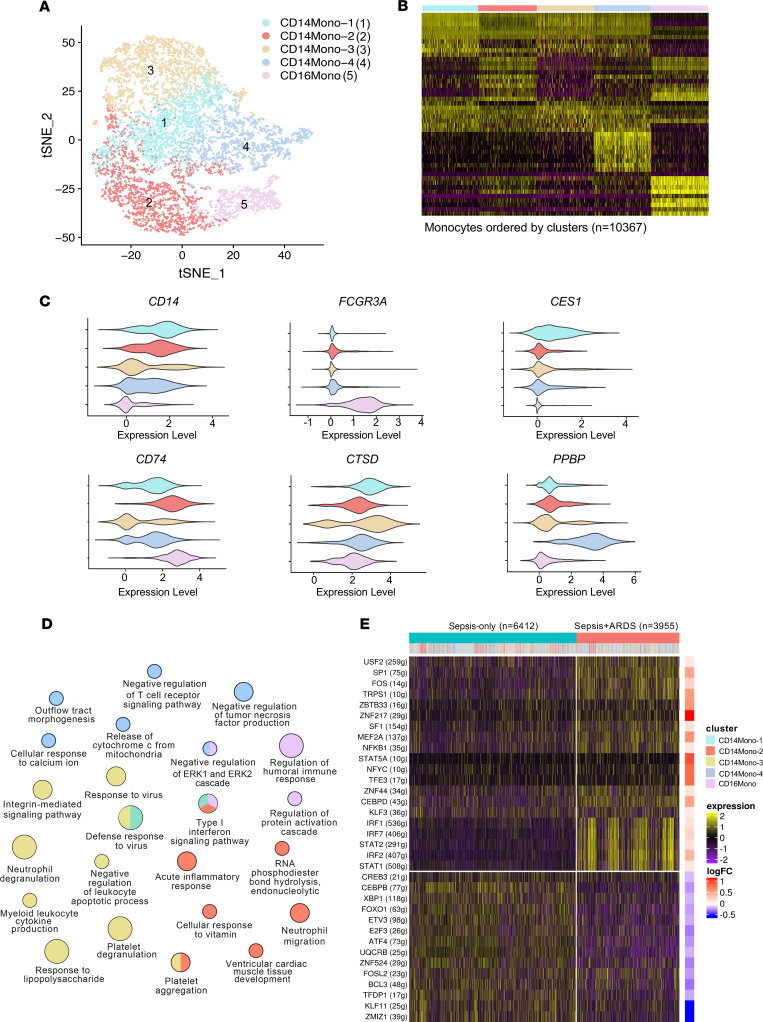
Figure 3. Monocyte clusters are identified in sepsis-only and sepsis+ARDS patients.
(A) Monocyte clusters in combined patient samples (n = 4, sepsis-only; n = 3, sepsis+ARDS) are identified by t-SNE distribution. The number in the parenthesis corresponds to the color-coded cell cluster. (B) A heatmap of gene expression in the pooled monocyte clusters is associated with the corresponding cluster in A using the color-coded bar at the top. (C) Violin plots demonstrate expression of the genes that identify each monocyte cluster. (D) Enriched biologic pathways for upregulated genes in sepsis+ARDS patients are demonstrated using ClueGO biological processes. Each node represents a biological process, and the size of the nodes correspond to the enrichment significance. Colors in the nodes correspond to the monocyte clusters in A. (E) The heatmap demonstrates monocyte transcription factor module expression by patient group and monocyte cluster, with log2FC illustrated on the right side. Data shown represent results obtained from pooled samples in each group.

