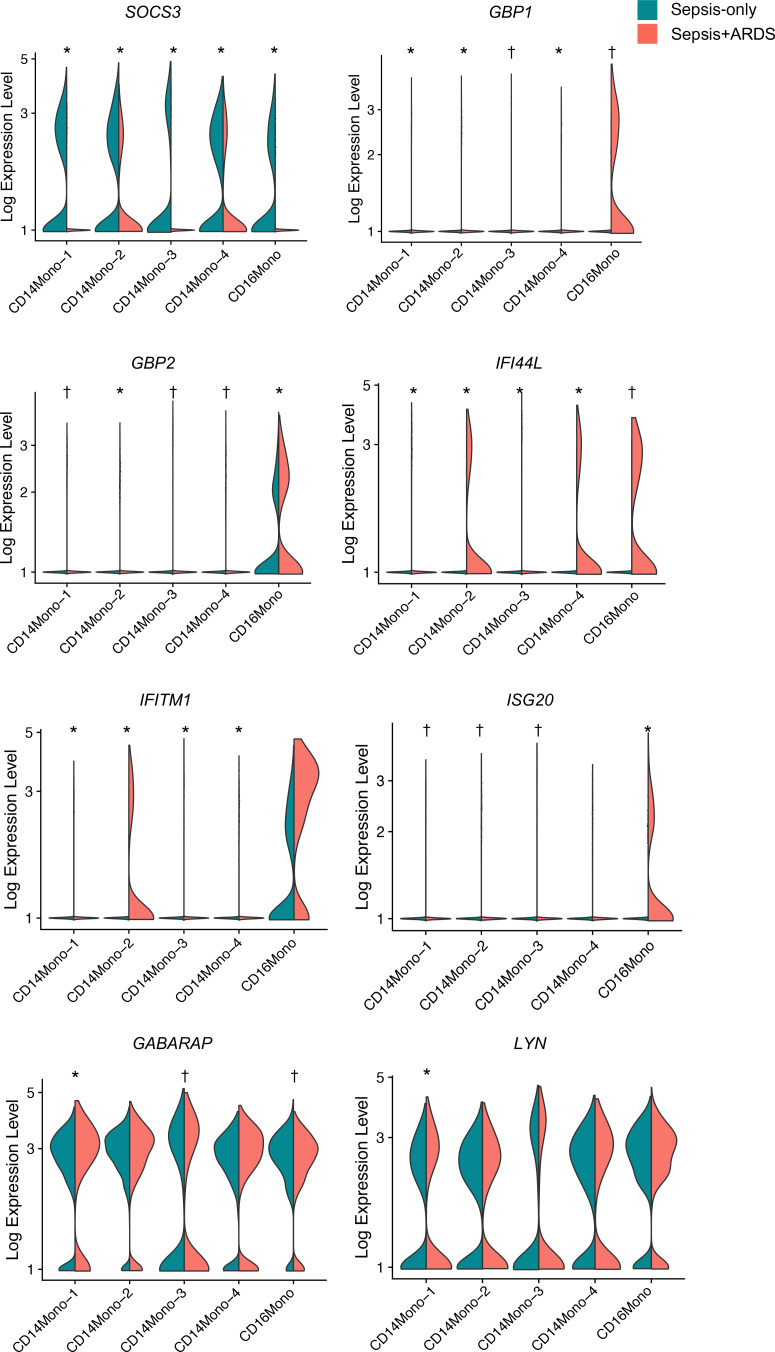
Figure 4. Downregulation of SOCS3 expression in monocyte clusters and increase in expression of IFN-stimulated genes.
Violin plots of expression of selected genes in the monocyte clusters are shown for sepsis-only (n = 4) and sepsis+ARDS (n = 3) patients. *P< 0.01, representing genes significantly differentially expressed between sepsis-only and sepsis+ARDS patients within each monocyte population, at Bonferroni-corrected P value in MAST but not in Wilcoxon rank sum test; †P < 0.01, representing significance at Bonferroni-corrected P value in both MAST and Wilcoxon rank sum test.

