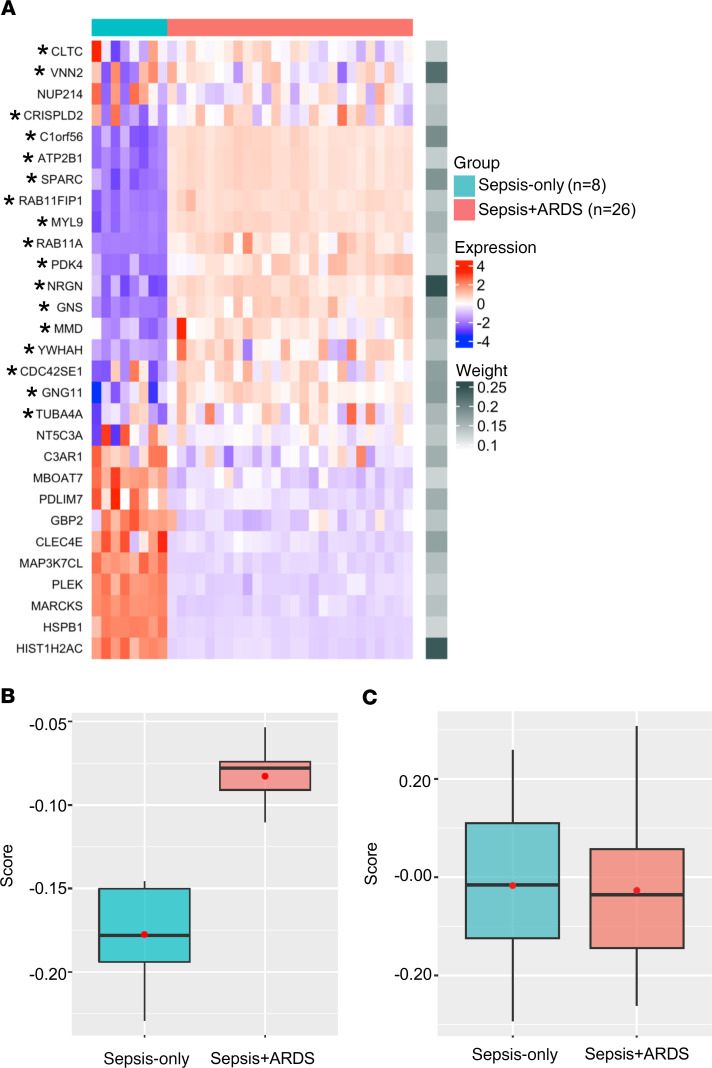
Figure 5. Differential gene expression in monocytes can distinguish between sepsis-only and sepsis+ARDS patients.
(A) Heatmap showing expression levels and weights assigned to each of the 29 genes that distinguish between patients with sepsis only (n = 8) and those with sepsis+ARDS (n = 26) in our scRNA-seq data as compared with microarray gene expression data of peripheral blood monocytes that were publicly available in 2 data sets. Asterisks indicate genes upregulated in both the scRNA-seq data set and publicly available data sets. (B and C) Comparison between groups using the ARDS risk score comprising 29 genes (B) versus a random selection of genes (C). Box-and-whisker plots show the median (bar) with IQR (box) and upper/lower limit within 1.5 IQRs from the box range (whiskers). The red dot indicates the mean of the score values. In B, values of the box plot for scores of sepsis-only patients are: minimum = –0.23, lower = –0.19, middle = –0.18, upper = –0.15, maximum = –0.15. For sepsis+ARDS patients: minimum = –0.11, lower = –0.09, middle = –0.08, upper = –0.07, maximum = –0.05. In C, values of the box plot for scores of sepsis-only patients are: minimum = –0.29, lower = –0.12, middle = –0.01, upper = 0.11, maximum = 0.26. For sepsis+ARDS patients: minimum = –0.26, lower = –0.14, middle = –0.04, upper = 0.06, maximum = 0.31. Two-tailed Student’s t test was applied.

