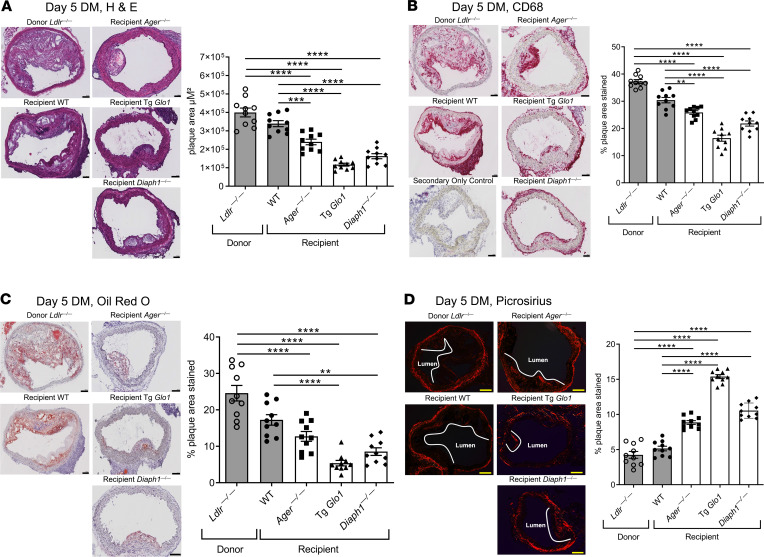
Figure 2. RAGE, GLO1, DIAPH1, and regression of atherosclerosis.
Representative images of H&E (A), CD68 (B), Oil red O (C), and Picrosirius red staining (D) of aortic arch donor and transplant sections and their quantification in Ldlr—/— (donor) and WT, Ager—/—, Tg Glo1, and Diaph1—/— diabetic recipient mice 5 days posttransplantation (N = 10 mice/group). Scale bar in A–D: 100 μm. In B, the secondary antibody–alone control is shown. Mean ± SEM; 1-way ANOVA with post hoc Tukey’s test was used. **P < 0.01, ***P < 0.001, and ****P < 0.0001.

