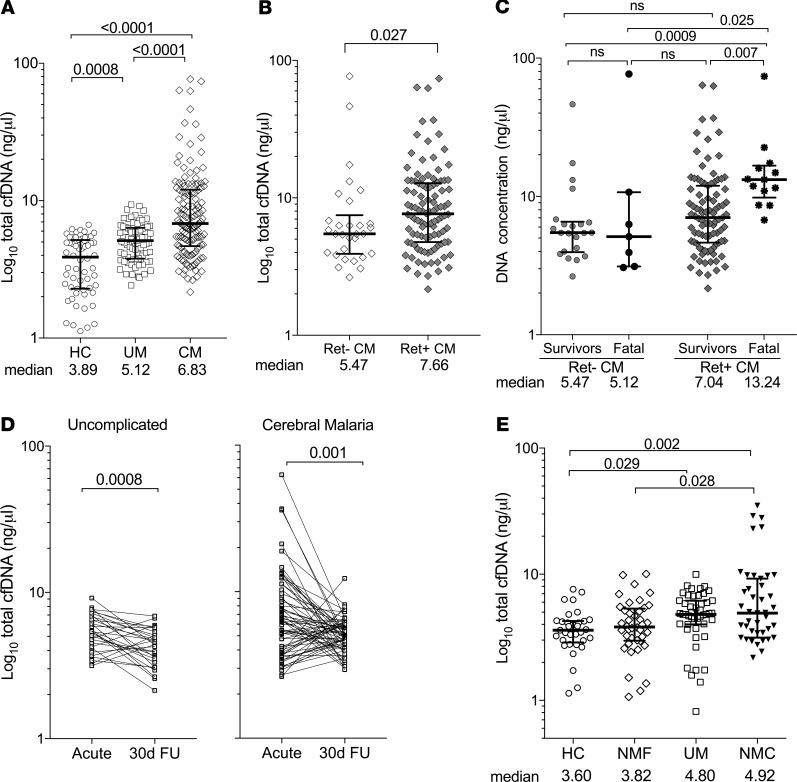
Figure 2. Total plasma cfDNA levels are elevated with malaria severity.
(A–C) Total plasma cfDNA levels (ng/μL) for clinical and control groups as measured by fluorometry. (A) Healthy controls (HC, n = 60) versus uncomplicated malaria (UM, n = 77) versus cerebral malaria (CM, n = 134). (B) CM classified as Ret– CM (n = 30) versus Ret+ CM (n = 104). (C) Survivors (Ret– CM, n = 22; Ret+ CM, n = 91) versus fatal cases (Ret– CM, n = 7; Ret+ CM, n = 13). (D) Total cfDNA levels in UM (n = 30) or CM (n = 67) convalescence from acute infection to 30-day follow-up (30d FU). (E) Total serum cfDNA levels of healthy controls (HC, n = 33), non–malaria febrile (NMF, n = 40), uncomplicated malaria (UM, n = 47), and non–malaria coma (NMC, n = 49) clinical groups. Shown are median levels ± IQR; statistical significance was determined by Mann-Whitney U test (B), Kruskal-Wallis test for multiple comparisons (A, C, and E), or Wilcoxon signed rank test for paired comparisons (D). P < 0.05 was considered significant.

