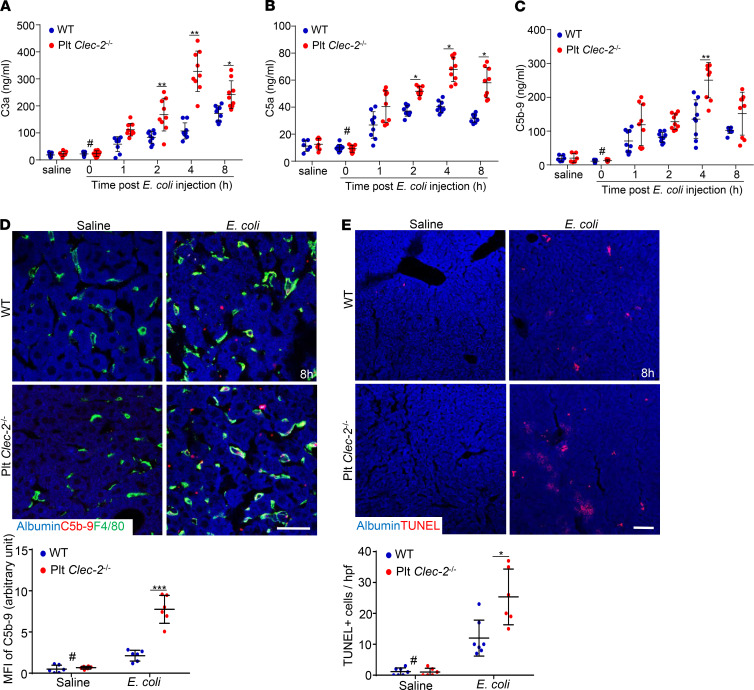
Figure 3. Platelet CLEC-2 deficiency increases complement activation and liver attack in early sepsis.
(A–C) Mouse plasma C3a, C5a, and C5b-9 levels measured by ELISA. Data are shown as mean ± SD. n = 9 mice/group. (D) Representative images of C5b-9 complex staining of liver cryosections at 8 hours after injection of E. coli or saline. (E) Representative images of TUNEL staining of liver cryosections. Bar graphs below were quantifications of C5b-9– or TUNEL-positive cells. hpf, high-power microscopic fields. The data are mean ± SD. n = 6 mice/group. #P < 0.05, comparing the sample at 0 hours of E. coli injection with samples at other time points after E. coli infection. *P < 0.05. **P < 0.01. ***P < 0.001. Data were analyzed using 1-way ANOVA followed by Tukey’s test for multiple groups and were representative of 3 independent experiments. Scale bar: 10 μm (D), 25 μm (E).

