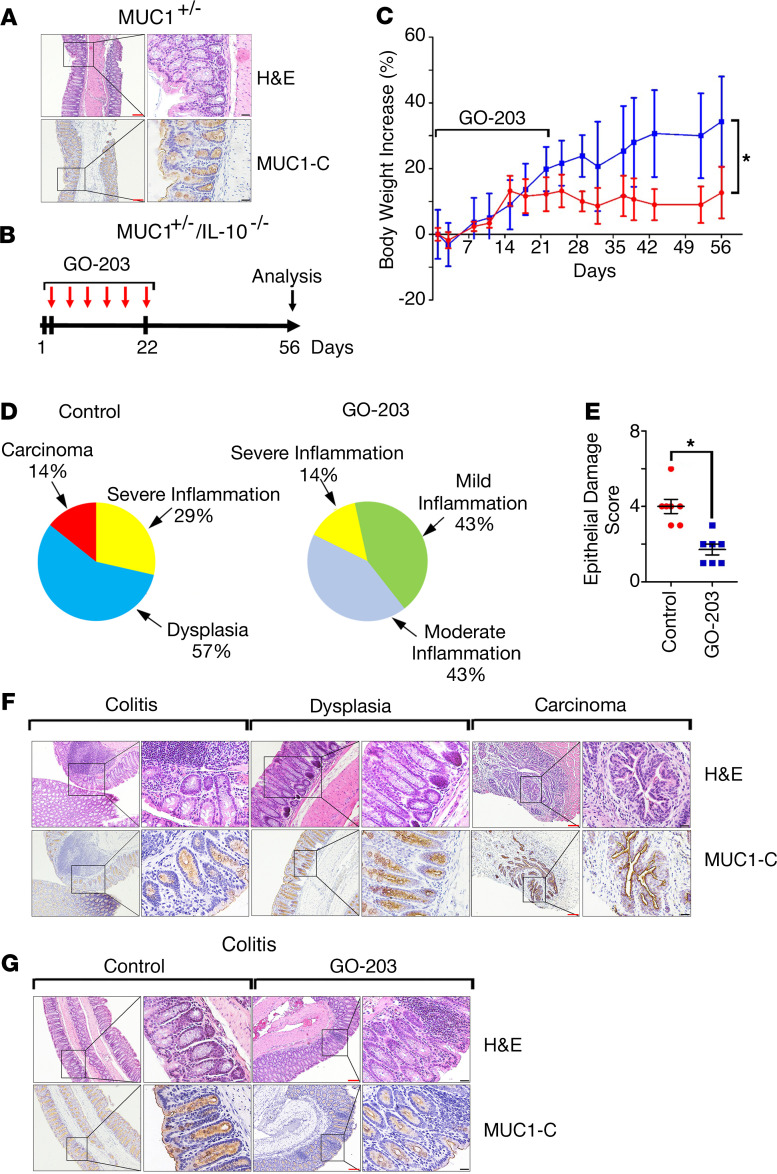
Figure 1. Targeting MUC1-C attenuates inflammation in MUC1+/– IL-10–/– mice.
(A) Images of descending colonic mucosa from a MUC1+/– mouse stained with H&E (upper) and for MUC1-C by IHC (lower). Red scale bars: 200 μm. Black scale bars: 50 μm. (B) Schema for GO-203 treatment of MUC1+/– IL-10–/– mice. GO-203 nanoparticles (GO-203/NPs) were administered i.p. twice a week for 3 weeks. (C) Body weight increase for untreated (shown in red) and GO-203–treated (shown in blue) MUC1+/– IL-10–/– mice. The results are expressed as the percentage increase (mean ± SEM) of baseline weight on day 1. Body weights on day 56 were compared using Student’s t test. The asterisk denotes a significant difference (P < 0.05). (D) Pie charts representing the percentage of control untreated (left) and GO-203–treated (right) MUC1+/– IL-10–/– mice with inflammation, dysplasia, and adenocarcinoma as determined by microscopic analysis and scoring of H&E staining (Supplemental Table 1). (E) Epithelial damage score of H&E-stained colons from control and GO-203–treated MUC1+/– IL-10–/– mice as determined by microscopic analysis (Supplemental Table 2). (F) Images of colons with colitis, dysplasia, and adenocarcinoma from control MUC1+/– IL-10–/– mice stained with H&E (upper panels) and for MUC1-C by IHC (lower panels). Red scale bars: 200 μm. Black scale bars: 50 μm. (G) Images of colons with colitis from control and GO-203–treated MUC1+/– IL-10–/– mice stained with H&E (upper panels) and for MUC1-C (lower panels). Red scale bars: 200 μm. Black scale bars: 50 μm.

