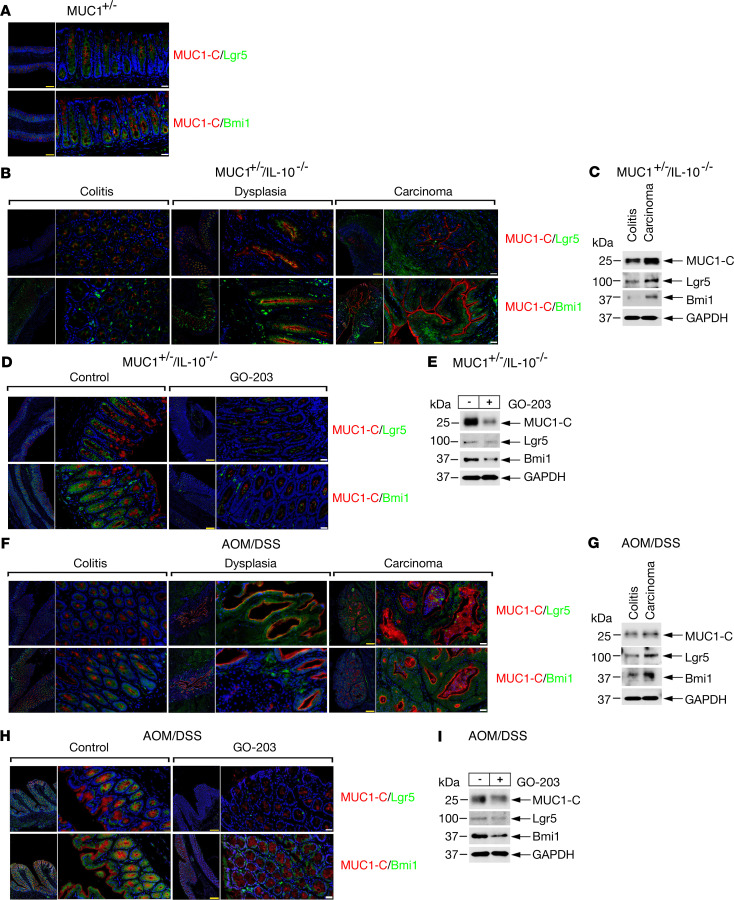
Figure 3. MUC1-C drives Lgr5 and Bmi1 in CACC models.
(A) Images of colon tissue from MUC1+/– mice stained for MUC1-C (red) and Lgr5 (green) (upper) or MUC1-C (red) and Bmi1 (green) (lower). Nuclei were stained with DAPI (blue). Scale bars: 200 μm (yellow), 50 μm (white). (B) Images of colitis, dysplasia, and carcinoma tissues from MUC1+/– IL-10–/– mice stained for MUC1-C (red) and Lgr5 (green) (upper) or MUC1-C (red) and Bmi1 (green) (lower). Nuclei were stained with DAPI (blue). Scale bars: 200 μm (yellow), 50 μm (white). (C) Lysates of colitis and carcinoma tissues from MUC1+/– IL-10–/– mice were immunoblotted with antibodies against the indicated proteins. (D) Images of colitis tissues from control and GO-203–treated MUC1+/– IL-10–/– mice stained for MUC1-C (red) and Lgr5 (green) (upper) or MUC1-C (red) and Bmi1 (green) (lower). Nuclei were stained with DAPI (blue). Scale bars: 200 μm (yellow), 50 μm (white). (E) Lysates of colitis tissues from control and GO-203–treated MUC1+/– IL-10–/– mice were immunoblotted with antibodies against the indicated proteins. (F) Images of colitis, dysplasia, and carcinoma tissues from AOM/DSS-induced MUC1+/– mice stained for MUC1-C (red) and Lgr5 (green) (upper) or MUC1-C (red) and Bmi1 (green) (lower). Nuclei were stained with DAPI (blue). Scale bars: 200 μm (yellow), 50 μm (white). (G) Lysates of colitis and carcinoma tissues from AOM/DSS-induced MUC1+/– mice were immunoblotted with antibodies against the indicated proteins. (H) Images of colitis tissues from control and GO-203–treated AOM/DSS-induced MUC1+/– mice stained for MUC1-C (red) and Lgr5 (green) (upper) or MUC1-C (red) and Bmi1 (green) (lower). Nuclei were stained with DAPI (blue). Scale bars: 200 μm (yellow), 50 μm (white). (I) Lysates of colitis tissues from control and GO-203–treated AOM/DSS-induced MUC1+/– mice were immunoblotted with antibodies against the indicated proteins.

