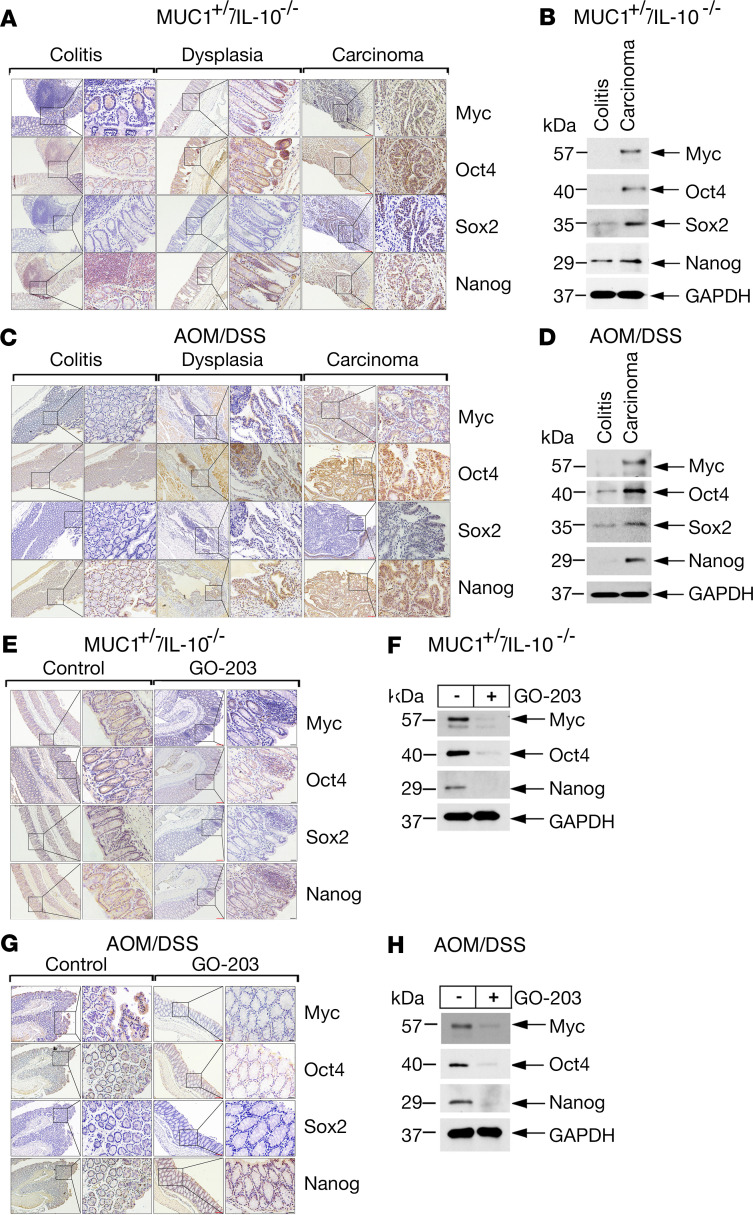
Figure 4. Targeting MUC1-C decreases pluripotency factor expression in CACC models.
(A) Images of colitis, dysplasia, and carcinoma tissues from MUC1+/– IL-10–/– mice stained for Myc, Oct4, Sox2, and Nanog. Red scale bars: 200 μm. Black scale bars: 50 μm. (B) Lysates of colitis and carcinoma tissues from MUC1+/– IL-10–/– mice run in the same gel as shown for data in Figure 3C were immunoblotted with antibodies against the indicated proteins and include the same GAPDH blots. (C) Images of colitis, dysplasia, and carcinoma tissues from AOM/DSS-induced MUC1+/– mice stained for Myc, Oct4, Sox2, and Nanog. Red scale bars: 200 μm. Black scale bars: 50 μm. (D) Lysates of colitis and carcinoma tissues from AOM/DSS-induced MUC1+/– mice run in the same gel as shown for data in Figure 3G were immunoblotted with antibodies against the indicated proteins and include the same GAPDH blots. (E) Images of colitis tissues from control and GO-203–treated MUC1+/– IL-10–/– mice stained for Myc, Oct4, Sox2, and Nanog. (F) Lysates of colitis tissues from control and GO-203–treated MUC1+/– IL-10–/– mice run in the same gel as shown for the data in Figure 3E were immunoblotted with antibodies against the indicated proteins and include the same GAPDH blots. (G) Images of colitis tissues from control and GO-203–treated AOM/DSS-induced MUC1+/– mice stained for Myc, Oct4, Sox2, and Nanog. (H) Lysates of colitis tissues from control and GO-203–treated AOM/DSS-induced MUC1+/– mice run in the same gel as shown for the data in Figure 3I were immunoblotted with antibodies against the indicated proteins and include the same GAPDH blots.

