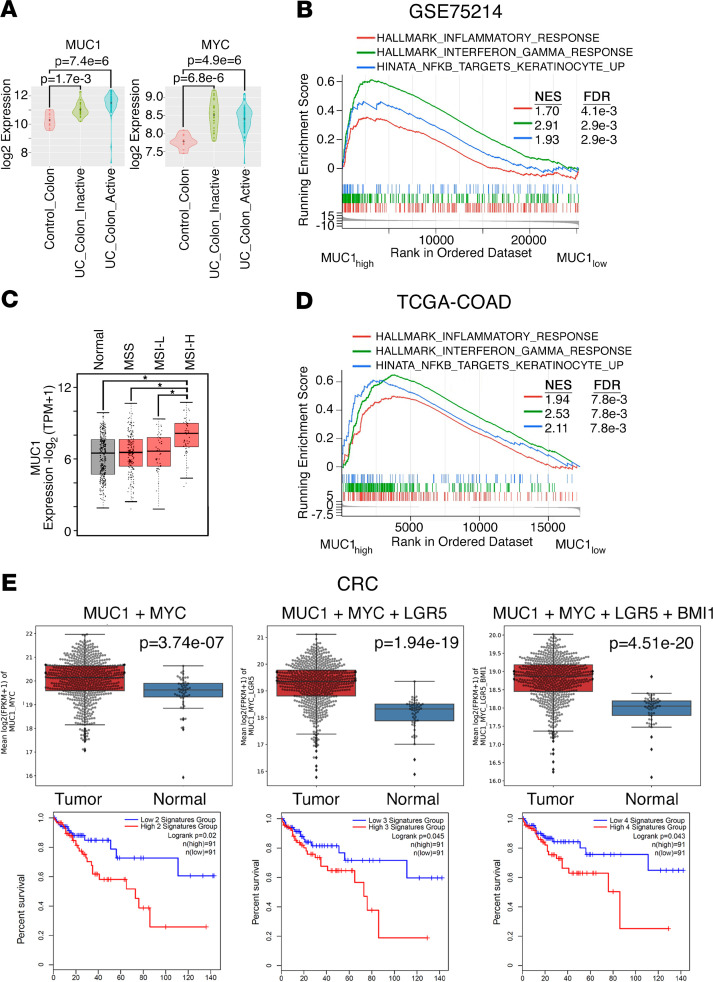
Figure 8. Upregulation of MUC1 expression in patients with UC and CRC.
(A) The GSE75214 data set containing expression profiles from control normal colon (n = 11), UC colon inactive (n = 23), and UC colon active (n = 74) samples was analyzed for MUC1 (left) and MYC (right) expression. The results are presented as violin plots. The dot in the center is the mean. Differences between groups were determined by the Wilcoxon rank sum test. (B) MUC1hi versus MUC1lo differential expression from UC samples (GSE75214) was assessed for functional enrichment with gene set enrichment analysis (GSEA) against the hallmark and canonical pathways. Enrichment plots for select gene signatures are shown. (C) The TCGA-COAD data set was analyzed for MUC1 expression in microsatellite stable (MSS) tumors (n = 175), microsatellite instability-low (MSI-L) tumors (n = 48), and microsatellite instability-high (MSI-H) tumors (n = 48) as compared with that in normal colon tissue (n = 41). (D) MUC1hi versus MUC1lo differential expression from CRC samples was assessed for functional enrichment with GSEA against hallmark and canonical pathways. Enrichment plots for select gene signatures are shown. (E) CRC samples (n = 638) (UCSC Xena data hub) were compared with normal colonic mucosa (n = 51) (upper). Multiple probe set IDs for the indicated genes were averaged for each patient sample after normalization to obtain a representative expression value. The center line indicates the median value, bounds of the box denote 25th (lower) and 75th (upper) percentiles, and whiskers indicate minimum (lower) and maximum (upper) values. Student’s t test was used to compare groups. Kaplan-Meier curves for relapse-free survival of patient groups with CRCs expressing the indicated genes (lower). Blue lines show low signatures groups; red lines, high signatures groups. P = 0.020, 0.045, and 0.043 for MUC1 + MYC, MUC1 + MYC + LGR5, and MUC1 + MYC + LGR5 + BMI1, respectively (log-rank test). For both high and low for MUC1 + MYC, MUC1 + MYC + LGR5, and MUC1 + MYC + LGR5 + BMI1, n = 91. TPM, transcripts per kilobase million; FPKM, fragments per kilobase million.

