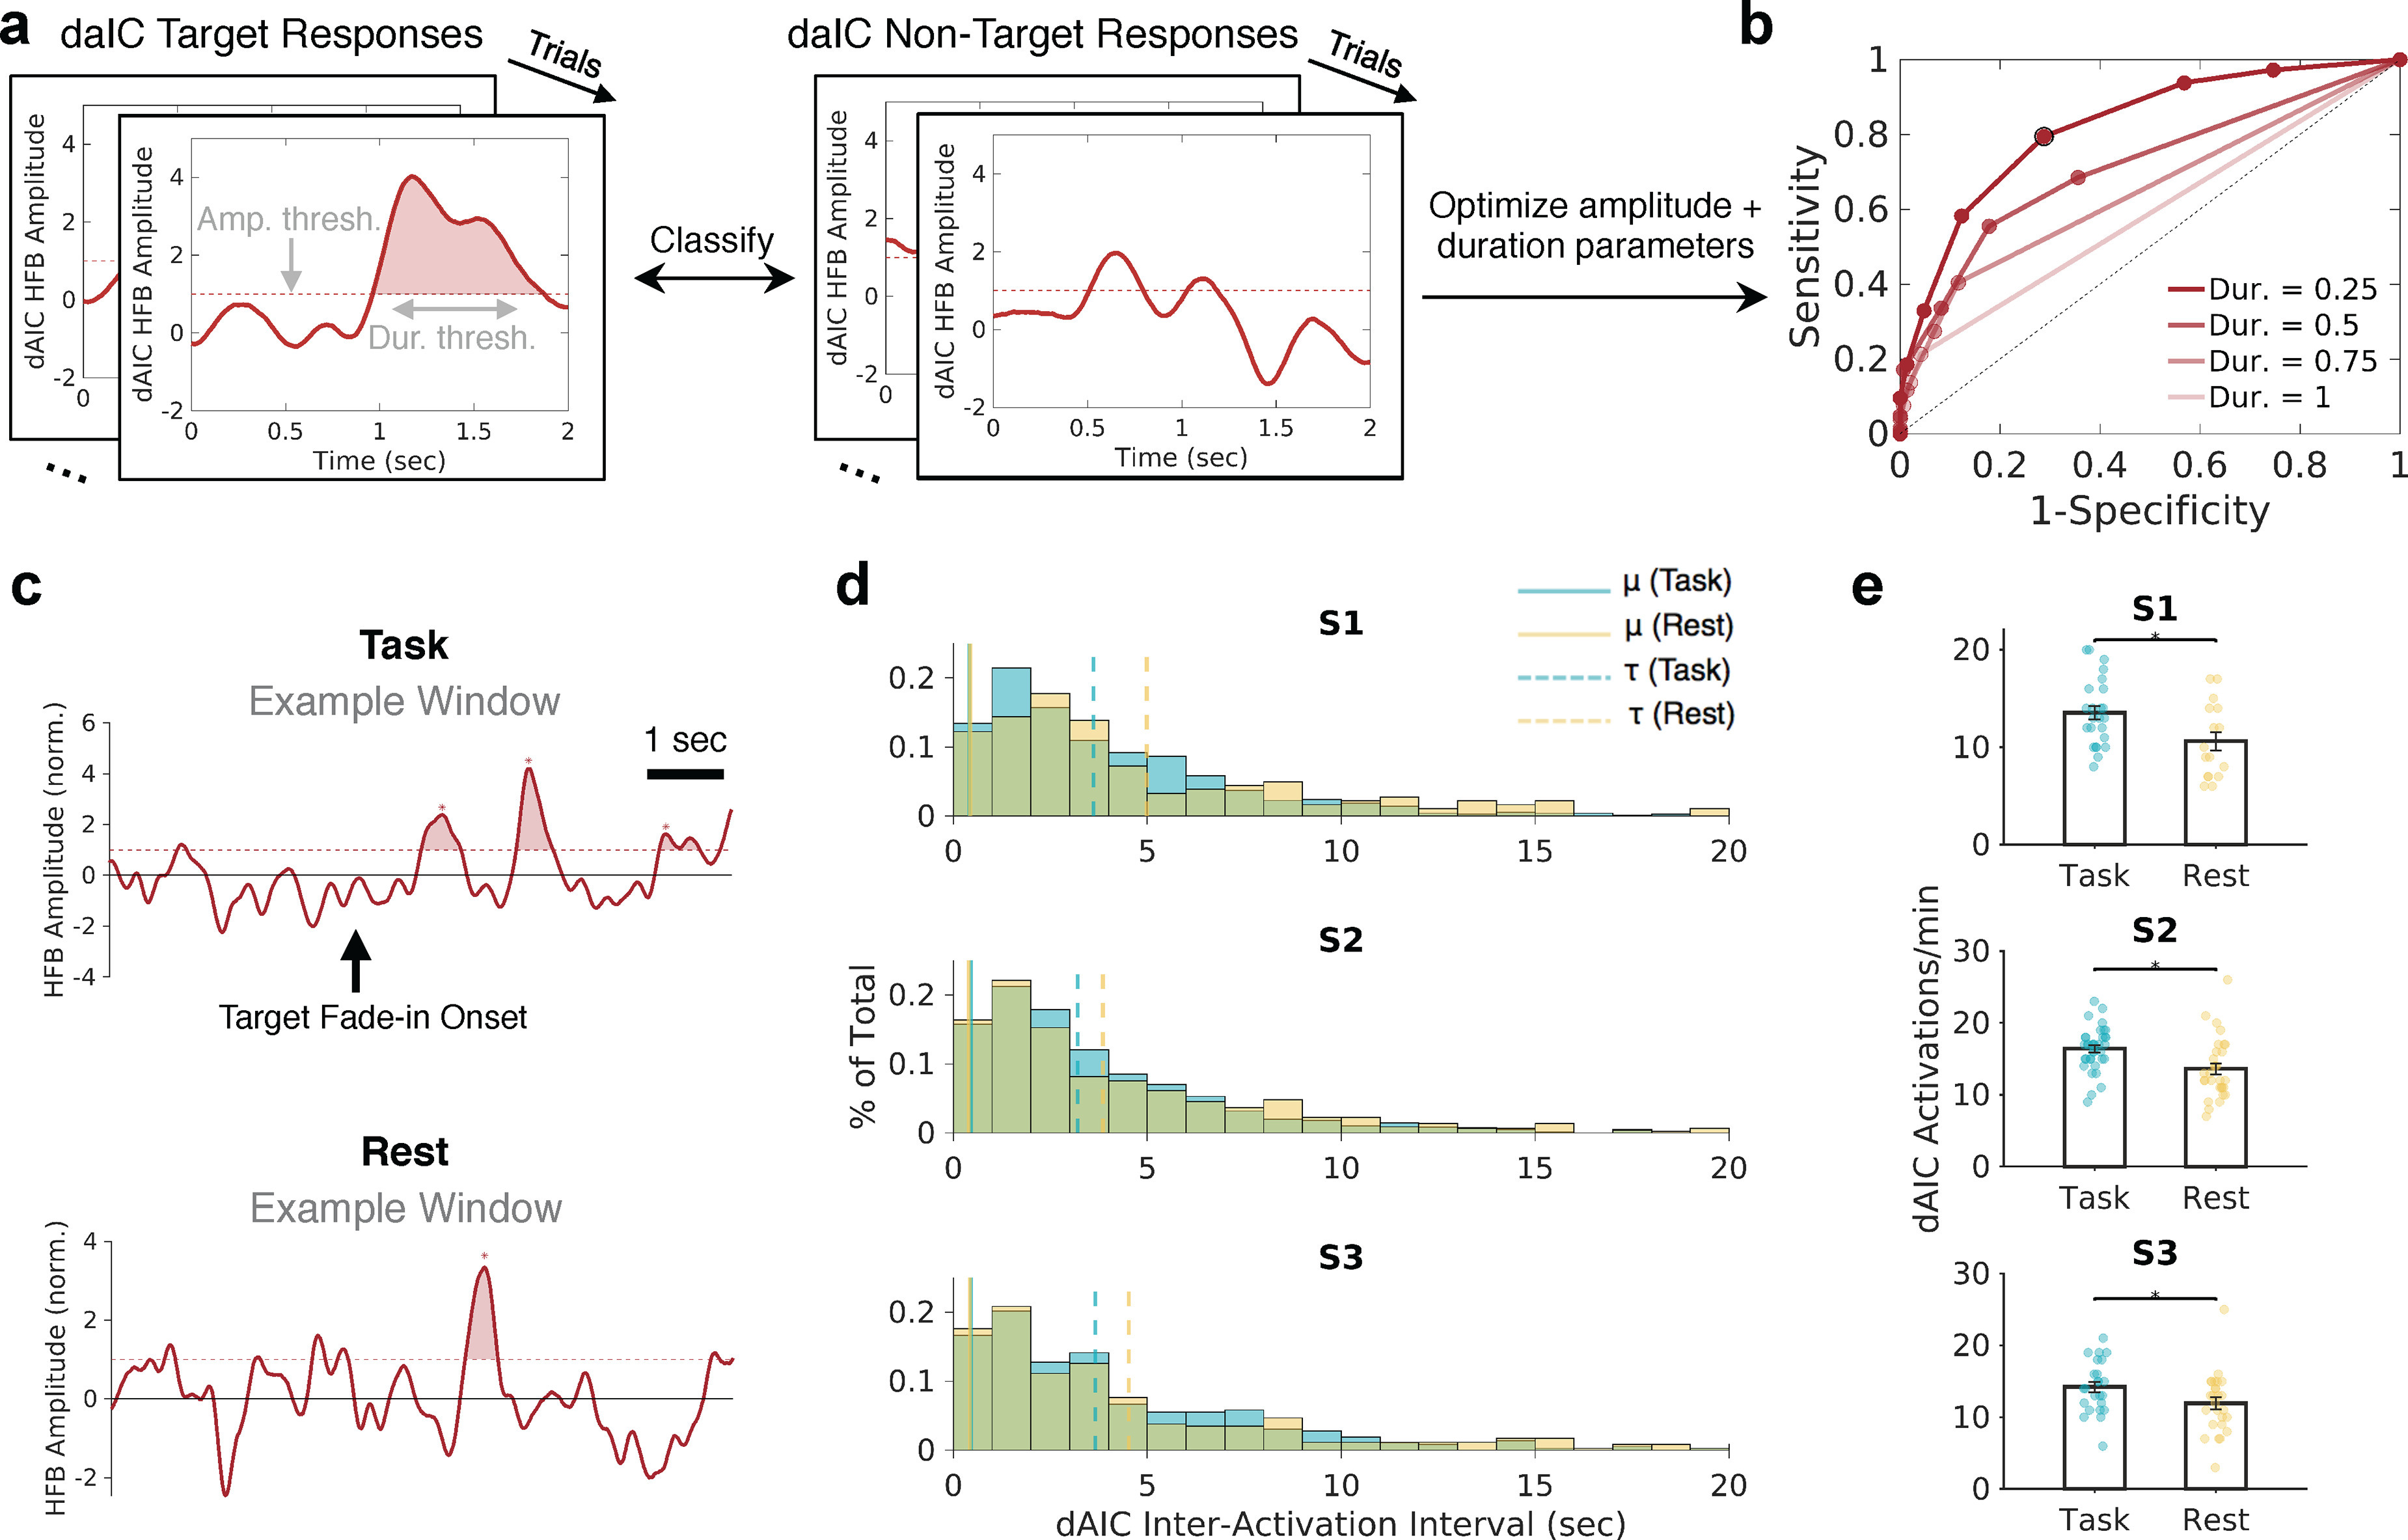
Figure 3.

daIC activations are detected during wakeful rest but are reduced in frequency. a, Example of the presence and absence of daIC activation during GradCPT target and nontarget trials, given selected amplitude and duration thresholds. b, Example ROC curve for a single daIC electrode based on multiple pairs of candidate amplitude and duration thresholds. The pair that resulted in optimized sensitivity and specificity for trial discrimination is outlined in black. c, Example 8 s segments showing daIC activations derived from ROC curves during task and rest conditions. Shaded areas represent suprathreshold events. d, Histograms represent daIC interactivation intervals across all task and rest sessions within each subject. Based on ex-Gaussian fits, the Gaussian mean (μ, solid vertical lines) and exponential mean (τ, dotted vertical lines) are shown for task and rest. e, Activation rates in the daIC, across independent 1 min windows, for task compared with rest within each subject. *p < 0.05 (Wilcoxon rank-sum test).
