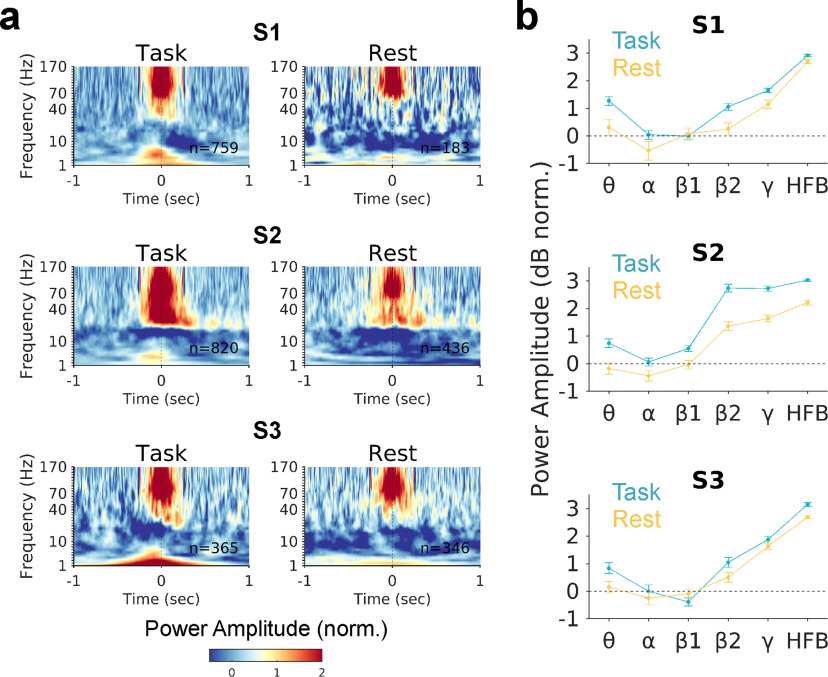
Figure 4.
Similar electrophysiological spectral properties between task-evoked and spontaneous daIC activation. a, Mean spectrograms, in task and wakeful resting state, aligned to HFB peaks (t = 0) defined based on ROC curves in task and rest.b, Mean power amplitude in the −50 to 50 ms window surrounding HFB peaks for the θ (4-8 Hz), α (8–12 Hz), β1(13–29 Hz), β2 (30–39 Hz), γ (40–70 Hz), and HFB ranges.

