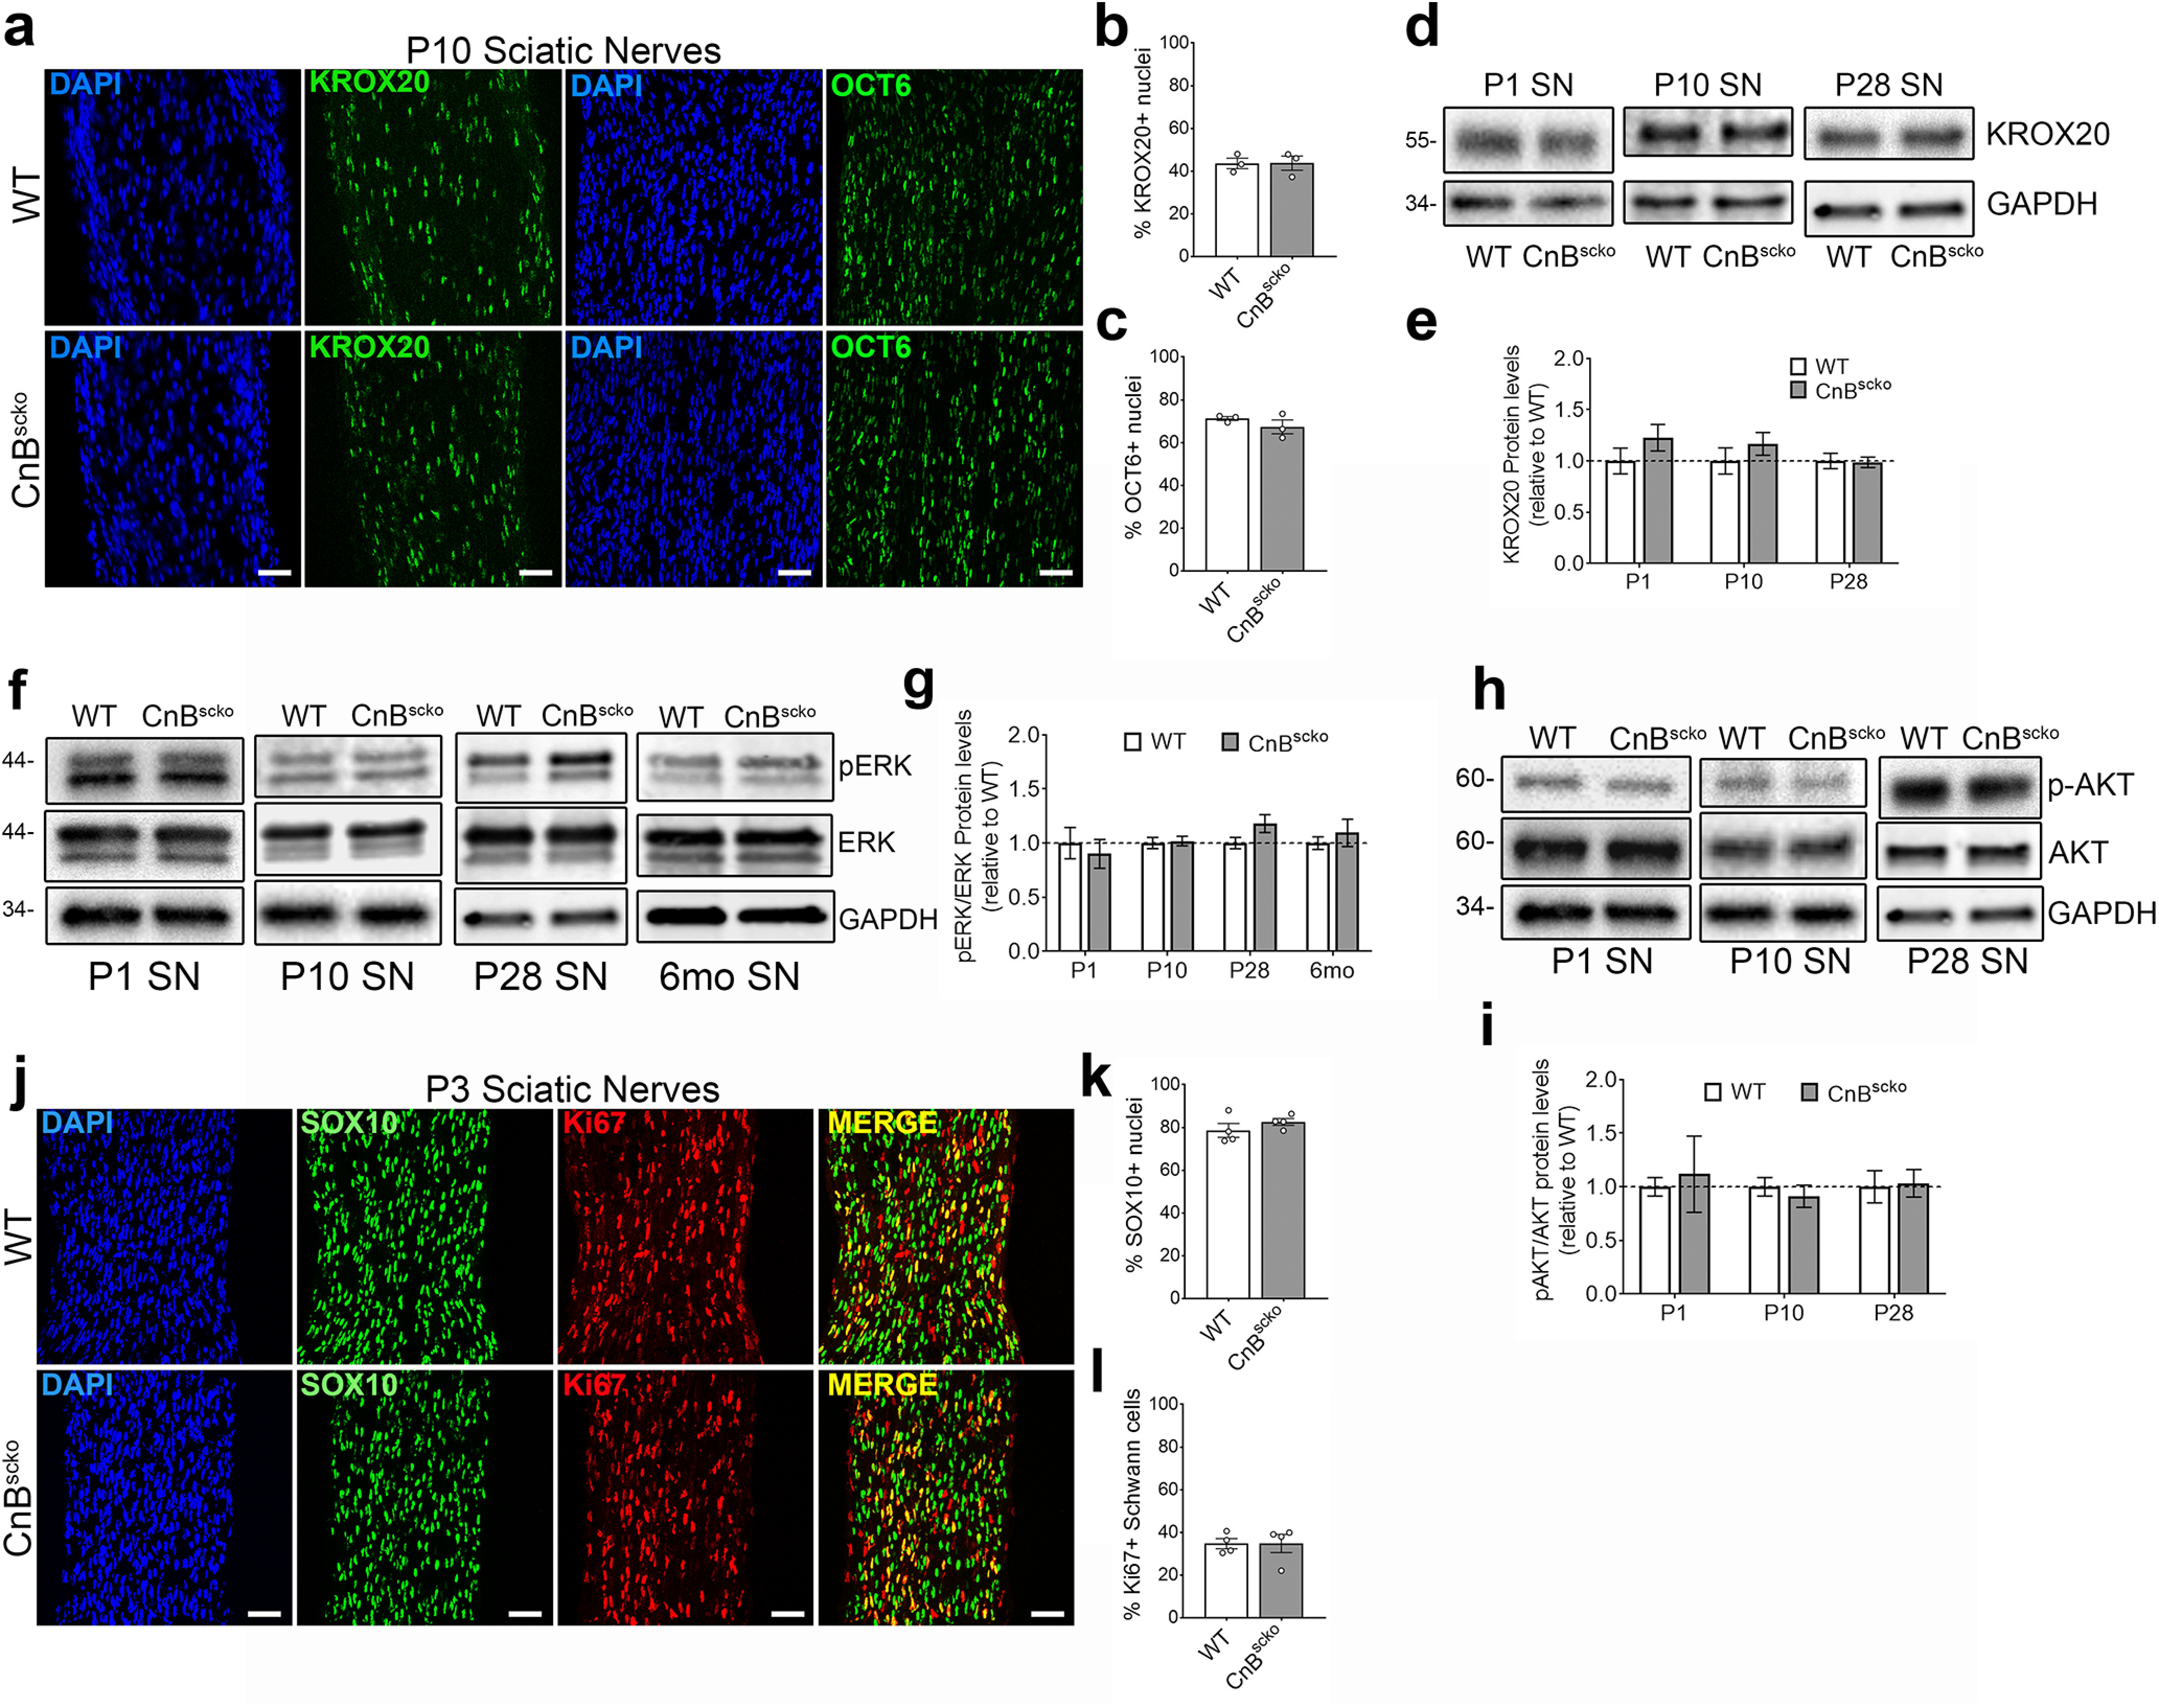
Figure 2.

a, Representative images from longitudinal sections of P10 WT and CnBscko sciatic nerves. Sections were stained with KROX20 or OCT6 and for DAPI. Scale bar, 50 µm. b, Quantification of percentage of nuclei that are KROX20+ from a. N = 3 mice/genotype. Error bar indicates SEM. c, Quantification of percentage of nuclei that are OCT6+ from a. N = 3 mice/genotype. Error bar indicates SEM. d, Representative WB images of KROX20 and GAPDH in sciatic nerve from mice aged P1, P10, and P28. e, Quantification of WB in d. Protein levels of KROX20 were normalized to GAPDH and then reported compared with WT. N = 4 pooled groups (P1) (3 or 4 mice per group), n = 10 mice (P10), n = 9 mice (P28). Error bar indicates SEM. f, Representative WB images of P-ERK, ERK, and GAPDH in WT or CnBscko sciatic nerve from mice aged P1, P10, P28, and 6 months. g, Quantification of WB in f. Protein levels of P-ERK and ERK were normalized to GAPDH and then reported as P-ERK/ERK levels compared with WT. N = 4 pooled groups (P1) (3 or 4 mice per group), n = 10 mice (P10), n = 9 mice (P28), n = 4 mice (6 months). Error bar indicates SEM. h, Representative WB images of P-AKT, AKT, and GAPDH in sciatic nerve from mice aged P1, P10, and P28. i, Quantification of WB in h. Protein levels of P-AKT and AKT were normalized to GAPDH and then reported as P-AKT/AKT levels compared with WT. N = 4 pooled groups (P1) (3 or 4 mice per group), n = 10 mice (P10), n = 9 mice (P28). Error bar indicates SEM. j, Representative images from longitudinal sections of P3 WT and CnBscko sciatic nerves. Sections were stained with SC marker, SOX10, and the proliferation marker, Ki67. Scale bar, 50 µm. k, Quantification of percentage of total nuclei that are SOX10+ in P3 WT and CnBscko sciatic nerves. N = 4 mice/genotype. Error bar indicates SEM. l, Quantification of percentage of SOX10+ cells that are Ki67+ in P3 WT and CnBscko sciatic nerves. N = 4 mice/genotype. Error bar indicates SEM.
