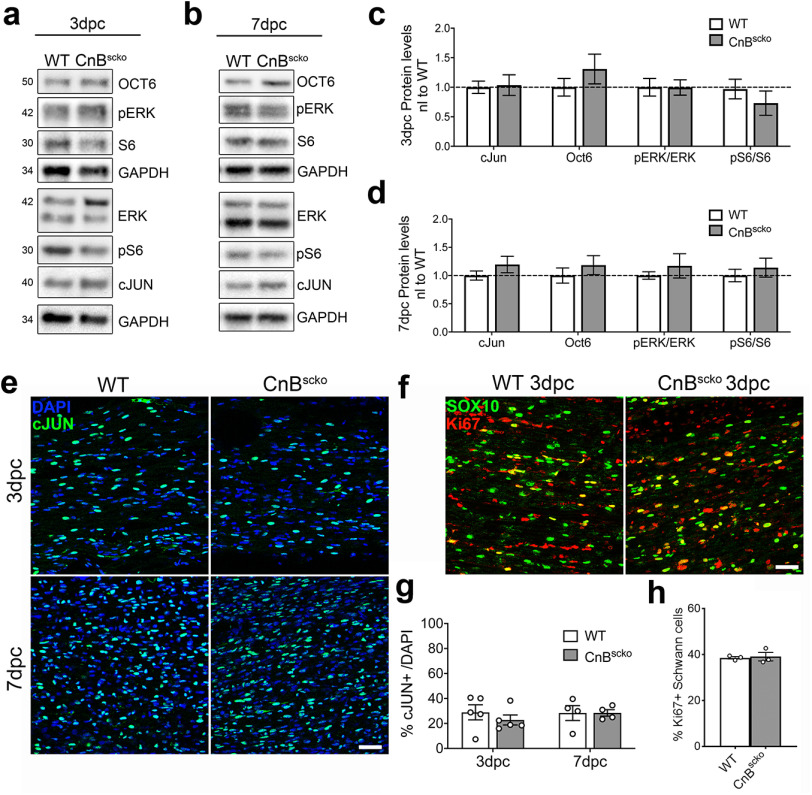
Figure 5.
a, b, Representative WB images from WT and CnBscko nerves at 3 and 7 dpc. c, d, Quantification of WBs shown in a, b. Protein levels were normalized to GAPDH and then reported normalized to average WT levels. Error bar indicates SEM. n = 9 mice/3 dpc, and n = 12 mice/7 dpc. e, Representative images of longitudinal sections from the distal portion of WT and CnBscko sciatic nerves, stained for c-JUN at 3 and 7 dpc. Scale bar, 50 µm. f, Representative images of longitudinal sections from the distal portion of WT and CnBscko sciatic nerves, stained for SOX10 and Ki67 at 3 and 7 dpc. Scale bar, 50 µm. g, Quantification of cJUN+ cells in WT and CnBscko sciatic nerves at 3 and 7 dpc. Error bars indicate SEM. n = 5 mice/3 dpc, and n = 4 mice/7 dpc. h, Quantification of the percentage of SOX10+ cells that were also Ki67+ in WT and CnBscko sciatic nerves at 3 and 7 dpc. Error bars indicate SEM. n = 5 mice/3 dpc, and n = 4 mice/7 dpc.

