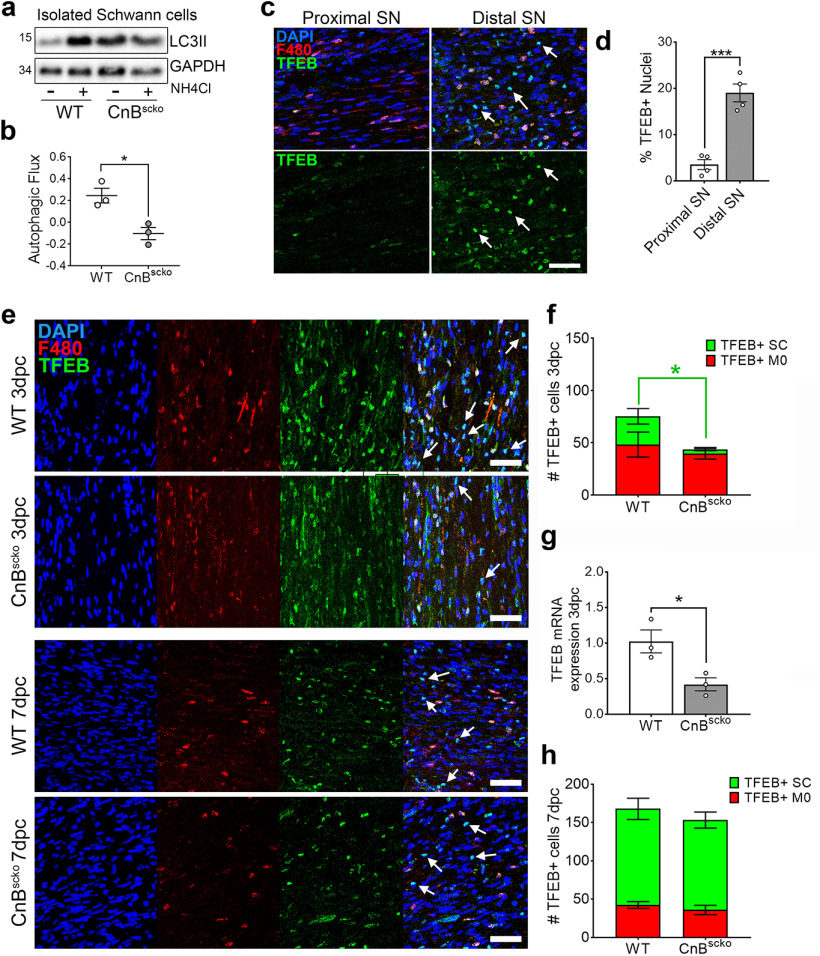
Figure 6.
a, Representative WB measuring LC3II expression in WT and CnBscko SCs. SCs cultured at 4 DIV were treated with NH4Cl for 3 h before lysis for WB. Each band represents the SCs isolated from the sciatic nerves of 1 P10 pup. N = 3 pups/treatment group. b, Autophagic flux was calculated by subtracting the average LC3II/GAPDH expression in untreated cells, from the LC3II/GAPDH expressions in treated cells, respectively. Error bar indicates SEM. *p < 0.05 (Student's t test). c, Representative images of the proximal and distal portions of a WT sciatic nerve at 7 dpc. Nerves were stained for F480 and TFEB. Scale bar, 50 µm. d, Quantification of the TFEB-positive nuclei. N = 4 mice. Error bar indicates SEM. ***p < 0.001 (Student's t test). e, Representative images of the distal portion of WT and CnBscko nerves at 3 and 7 dpc. Nerves were stained for F480 and TFEB. White arrows indicate TFEB-positive SCs. Scale bar, 50 µm. f, Quantification of TFEB-positive cells in the distal portion of WT and CnBscko sciatic nerves at 3 dpc. N = 5 mice/genotype. Error bar indicates SEM. *p < 0.05 (Student's t test). g, Quantification of TFEB mRNA expression in the distal portion of WT and CnBscko sciatic nerves at 3 dpc. Expression reported relative to average WT 3 dpc levels. N = 3 mice/genotype. Error bar indicates SEM. *p < 0.05. h, Quantification of TFEB-positive cells in the distal portion of WT and CnBscko sciatic nerves at 7 dpc. N = 5 mice/genotype. Error bar indicates SEM.

