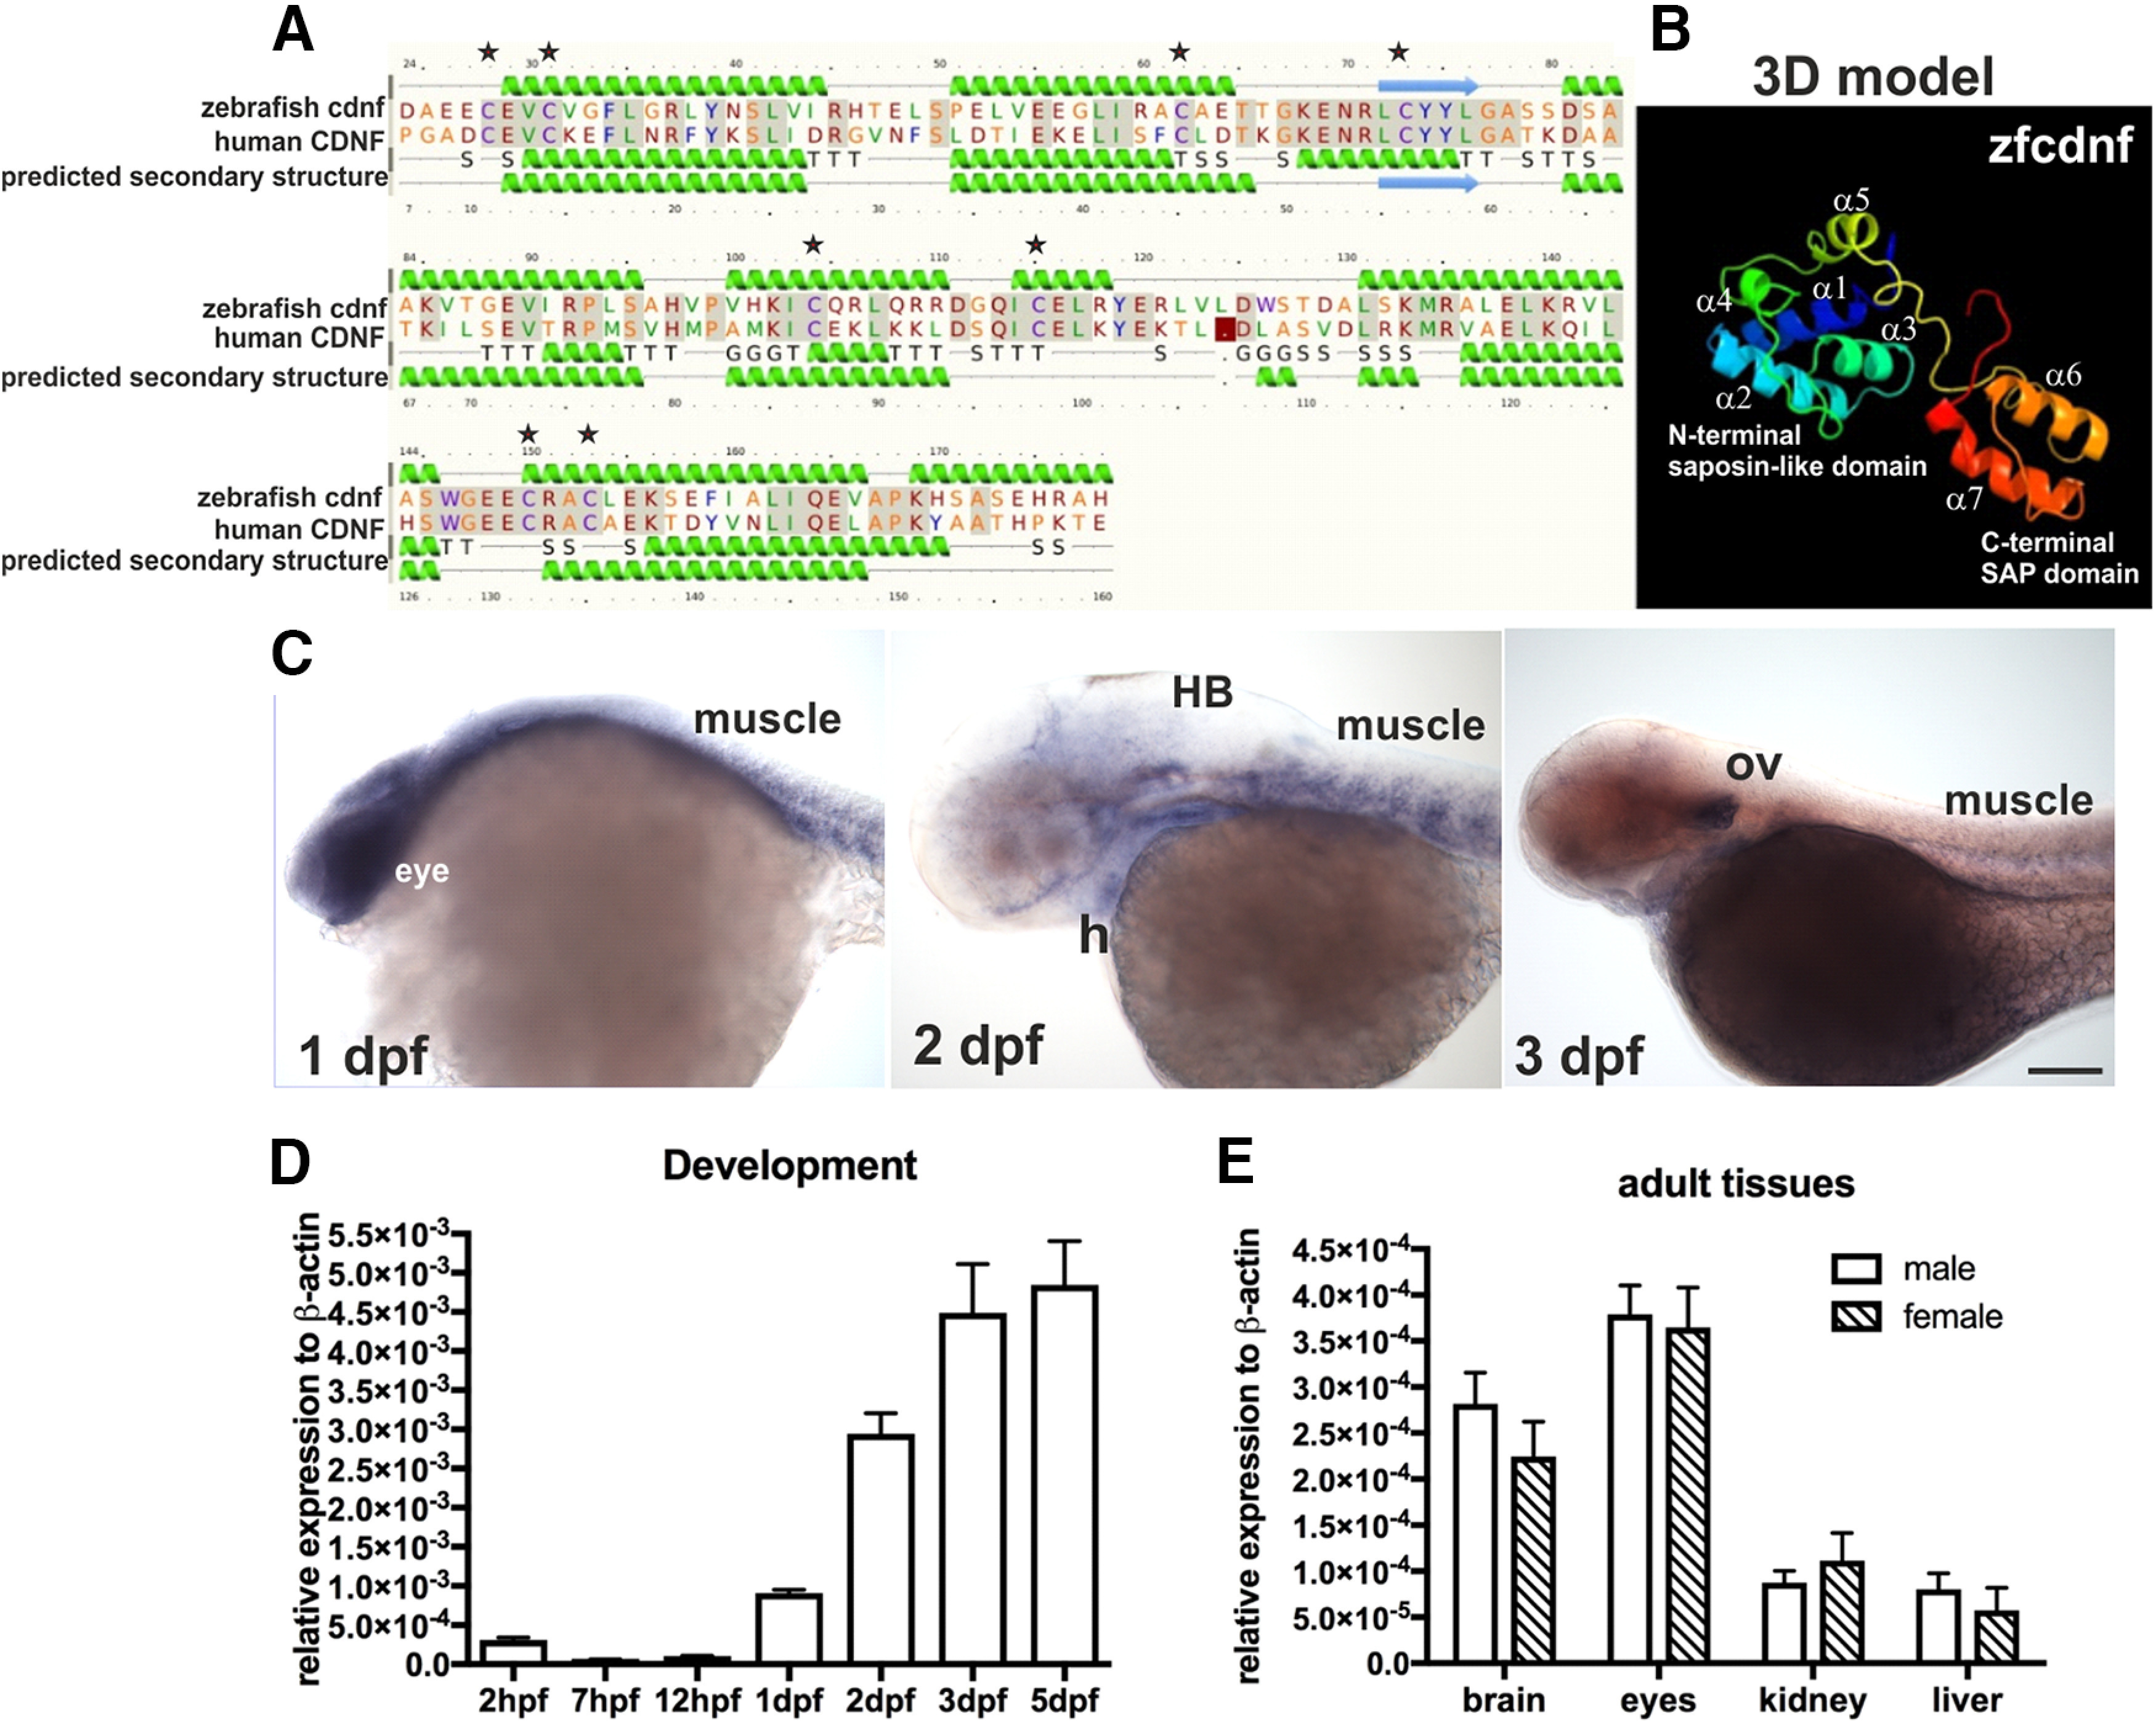
Figure 1.

Predicted domain structures and spatiotemporal expression of zebrafish cdnf. A, Secondary structure and (B) predictive 3D model of zebrafish cdnf by Phyre2 modeling with human CDNF. C, Whole-mount ISH highlighting cdnf expression in the head, eyes, heart, muscles, and optic vesicles during development. D, qRT-PCR showing the zygotic cdnf mRNA expression at various developmental stages (one-way ANOVA, F(6,14) = 40.31, p < 0.0001, n = 3), and (E) in various male and female adult organs (two-way ANOVA, F(1,32) = 3.885, p = 0.0574, n = 4/group). Green helices represent α-helices. Blue arrows indicate β-strands. Gray lines indicate the conserved amino-acid residues. G, 3-trun helix; T, hydrogen bonded turn; S, bend; H, heart; HB, hindbrain; ov, optic vesicle. Data are mean ± SEM. One-way or two-way ANOVA was used for statistics. Single asterisk shows the positioned-conserved cysteine residue.
