
Figure 11.
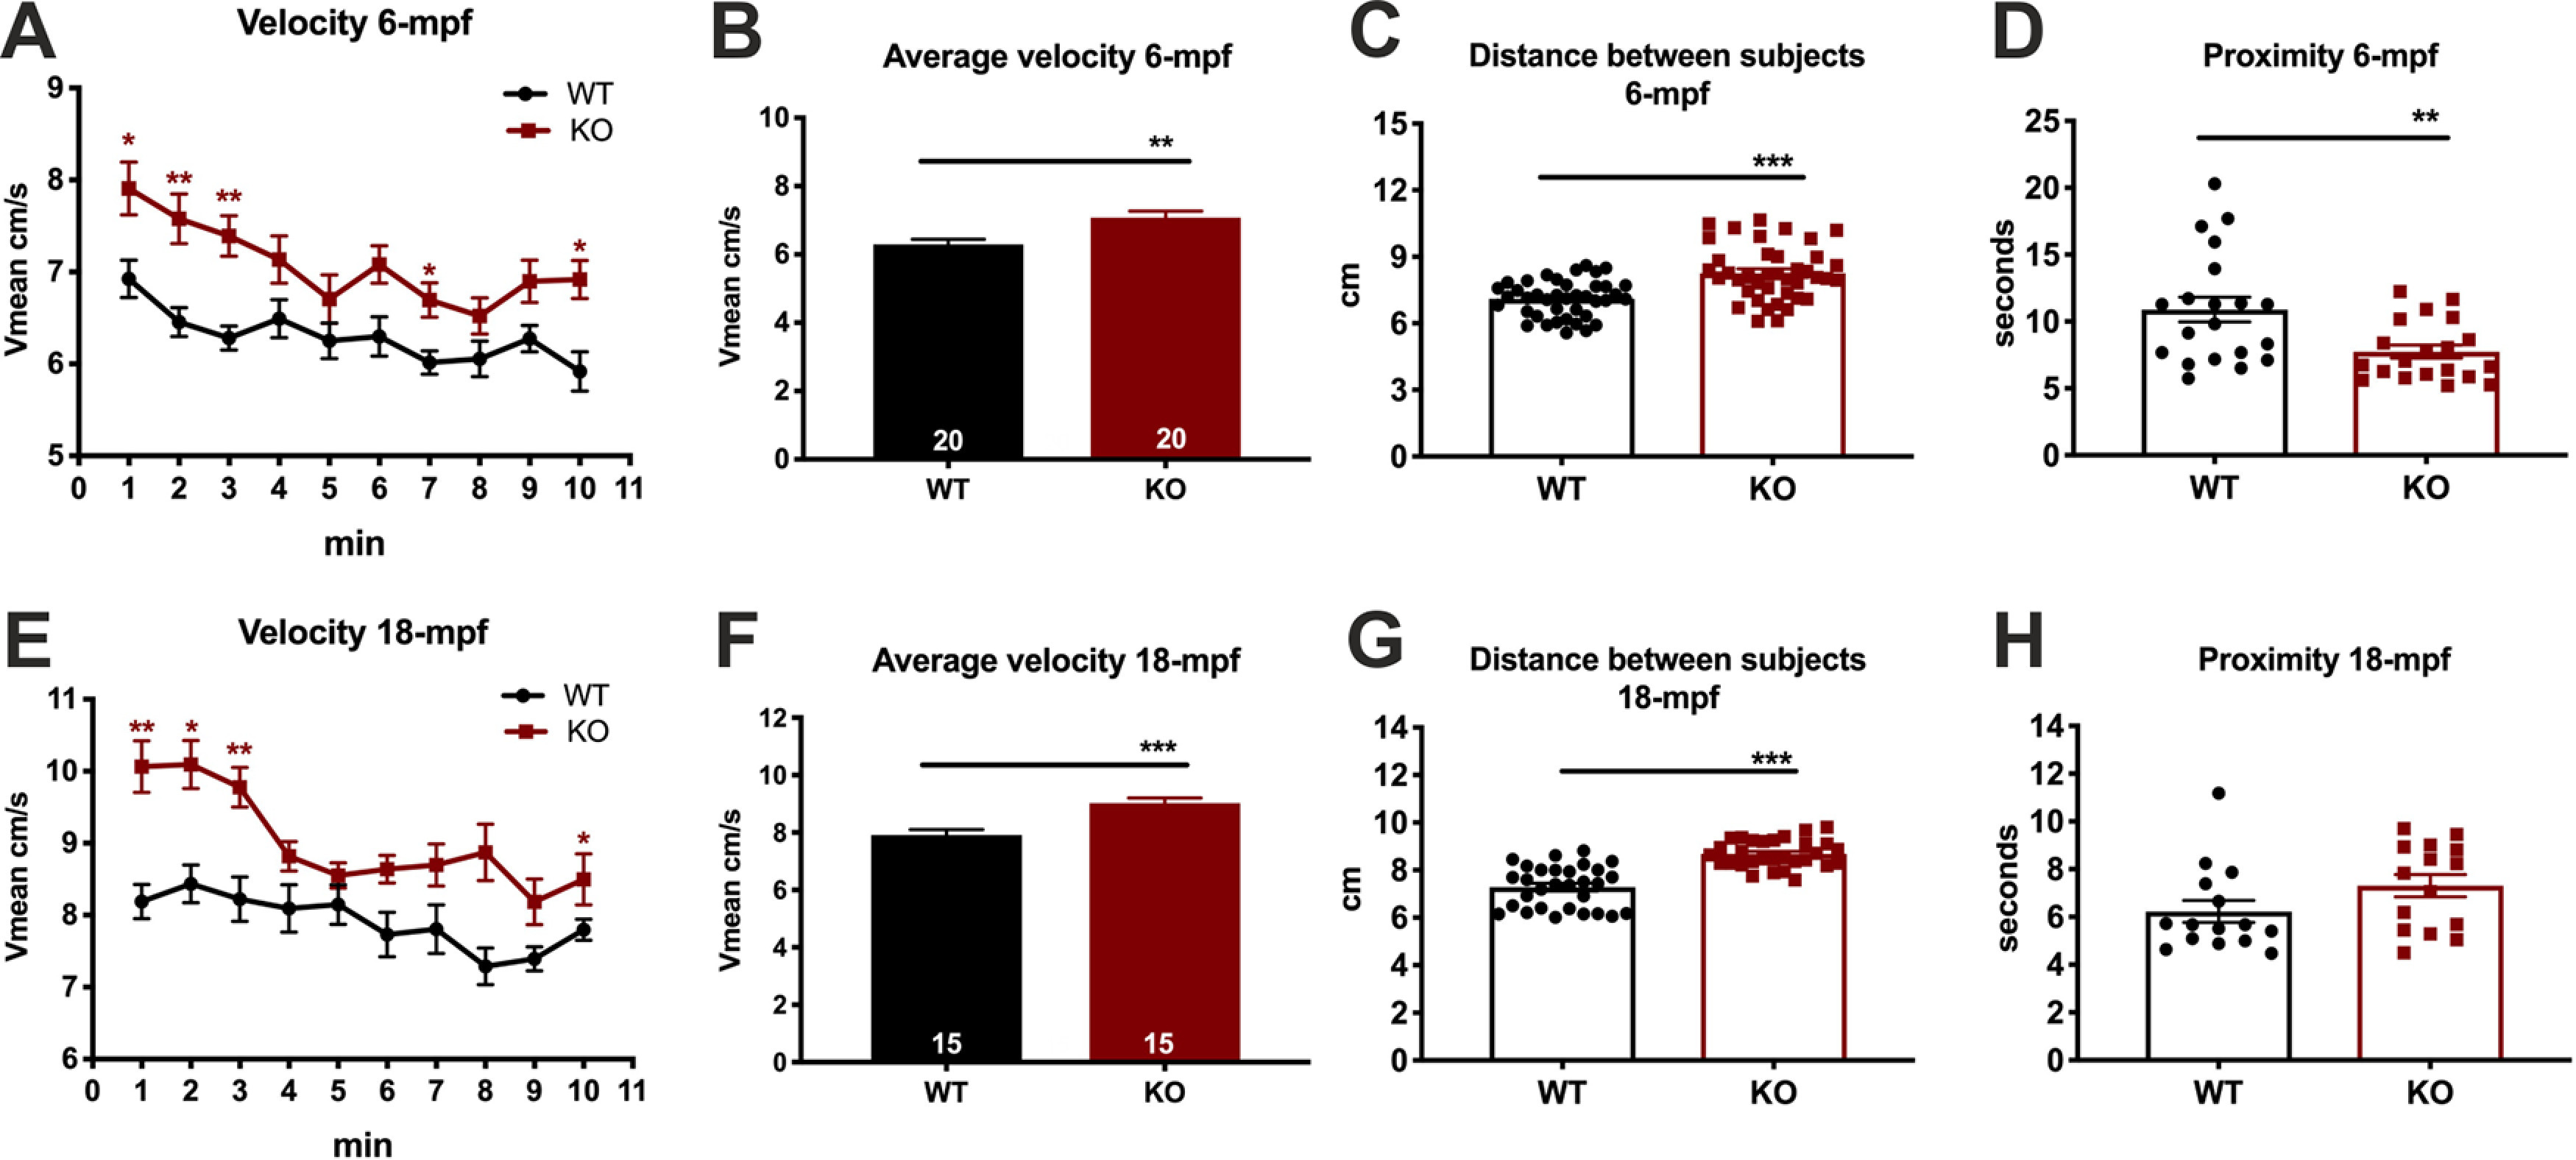
Decreased shoal cohesion in cdnf KO adult fish. Top, Shoaling behavior test on 6 mpf male cdnf WT and KO fish (n = 5 in each trial) during a 10 min video tracking period; four trials were analyzed. A, Average velocity, in 1 min time bins (multiple t tests, 1 min, t = 2.794, df = 38.0, p = 0.0477; 2 min, t = 3.576, df = 38, p = 0.0087; 3 min, t = 4.344, df = 38, p = 0.001; 7 min, t = 2.991, df = 38, p = 0.033; 10 min, t = 3.361, df = 38.00, p = 0.014). B, Average velocity during the 10 min video tracking period (unpaired t test, t = 3.300, df = 38, p = 0.0021). C, Average interindividual distance of total trials (unpaired t test, t = 4.964, df = 78, p < 0.0001). D, Average time spent in the proximity (i.e., <2 cm) of the nearest neighbor. Bottom, Shoaling behavior test on 18 mpf male cdnf WT and KO fish (n = 5 in each trial); three trials were analyzed (unpaired t test, t = 2.973, df = 38, two-tailed p = 0.0051). E, Average velocity, in 1 min time bins (multiple t tests, 1 min, t = 4.351, df = 28.0, p = 0.0016; 2 min, t = 3.898, df = 28, p = 0.0050; 3 min, t = 3.726, df = 28, p = 0.0070; 8 min, t = 3.392, df = 28, p = 0.0145). F, Average velocity during the 10 min video tracking period (unpaired t test, t = 4.122, df = 28, p = 0.0003). G, Average interindividual distance of total trials (unpaired t test, t = 7.264, df = 58, p < 0.0001). H, Average time spent in the proximity of closest neighbor (unpaired t test, t = 1.649, df = 28, p = 0.1103). Data are mean ± SEM. *p < 0.05; **p < 0.01; ***p < 0.001; Student's t test and one-way ANOVA analysis with multiple comparisons.