
Figure 13.
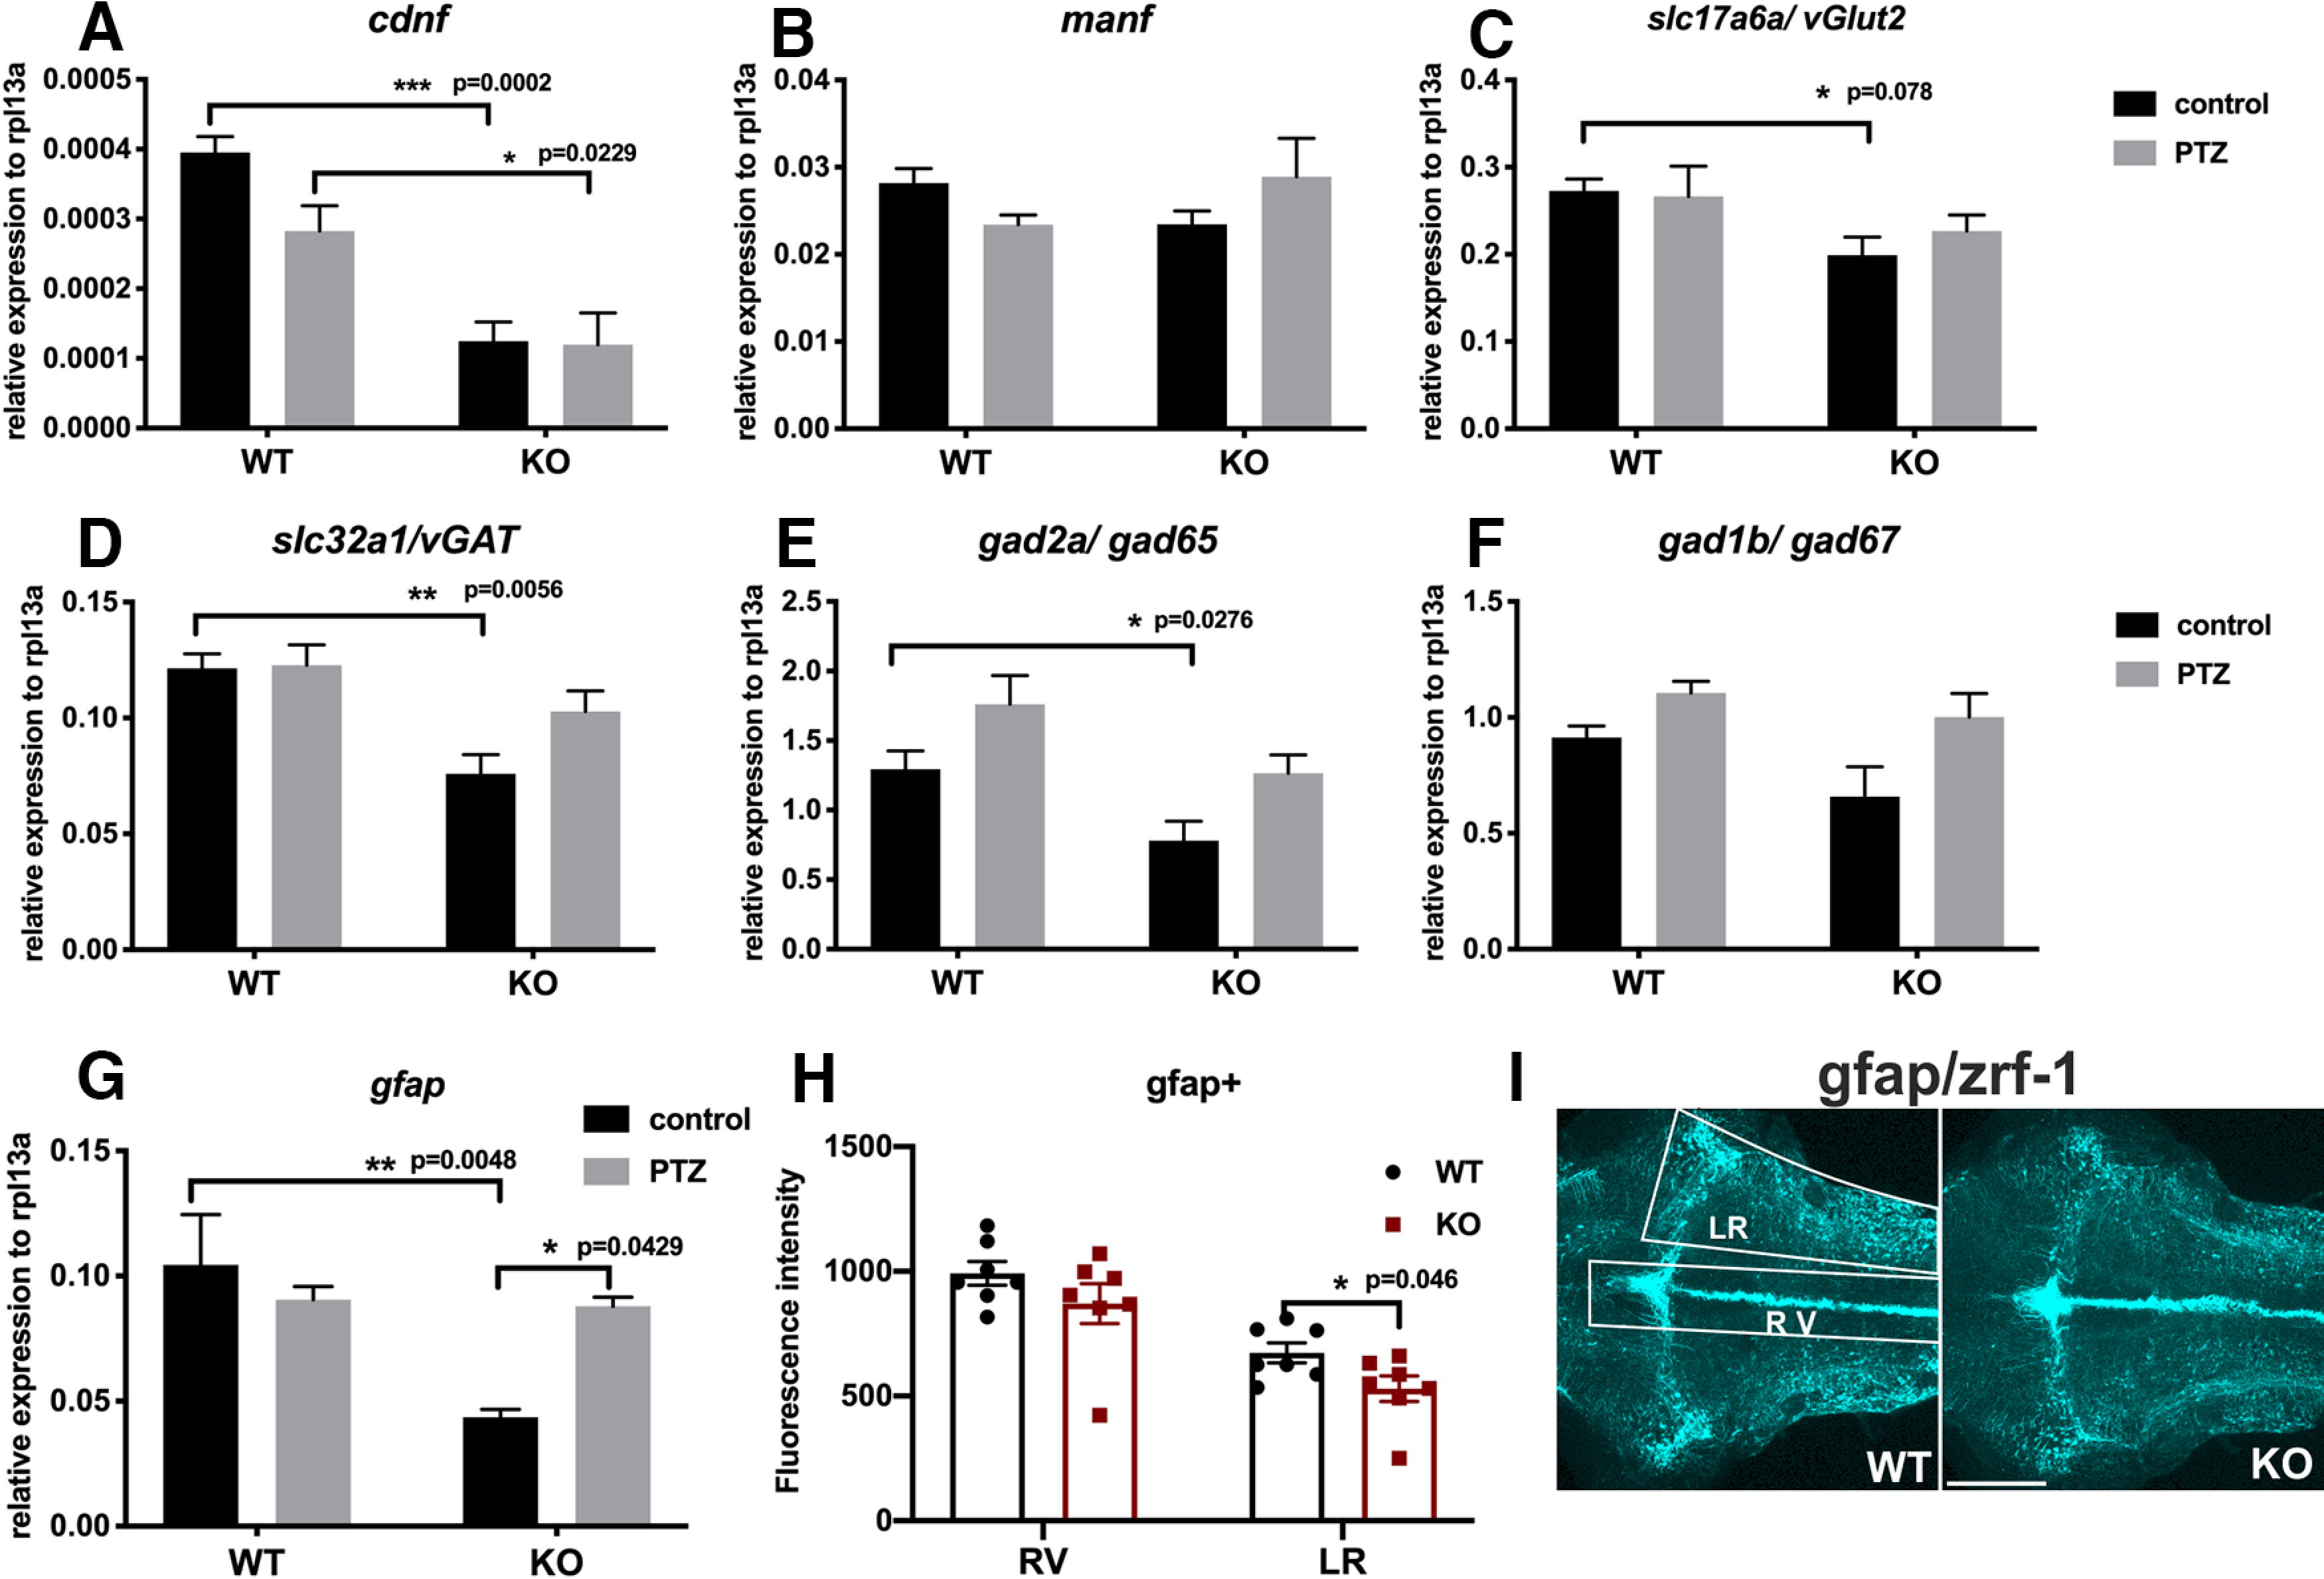
Results of qRT-PCR analysis in PTZ-treated cdnf KO fish. Quantification of relative expression of (A) cdnf (two-way ANOVA, F(1,16) = 40.14, p < 0.0001), (B) manf (two-way ANOVA, F(1,16) = 0.02213, p = 0.8836), (C) slc17a6a/vGlut2 (two-way ANOVA, F(1,16) = 16.16, p = 0.0010), (D) slc32a1/vGAT (two-way ANOVA, F(1,16) = 40.14, p < 0.0001), (E) gad2a/gad65 (two-way ANOVA, F(1,16) = 10.68, p = 0.0048), (F) gad1b/gad67 (two-way ANOVA, F(1,16) = 4.052, p = 0.0613), and (G) gfap (two-way ANOVA, F(1,16) = 8.813, p = 0.0091) in 6 mpf brains with or without PTZ treatment. n = 5 in each group. H, Quantification of fluorescence intensity of zrf-1 immunostaining signals of 10 dpf cdnf WT and KO fish brains (two-way ANOVA, F(1,24) = 33.8, p < 0.0001). I, Quantification of fluorescence intensity of gfap-positive radial glial cells (shown in H) was done in the ROIs shown in white boxes. RV, Rhombencephalic ventricle; LR, lateral region of raphe. Data are mean ± SEM. *p < 0.05; **p < 0.01; ***p < 0.001; two-way ANOVA analysis with Tukey's multiple comparisons test. Scale bar, 100 µm.