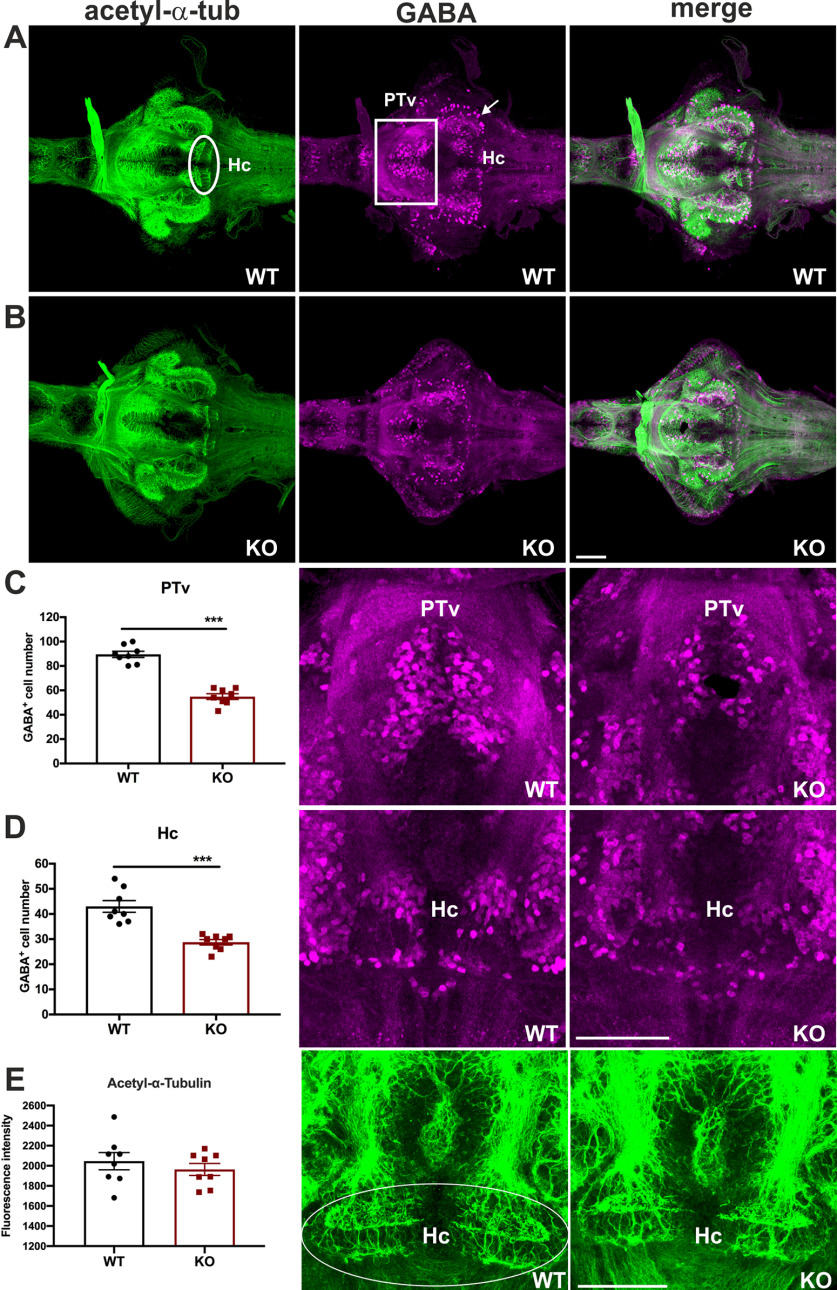
Figure 6.
Selective impairment of GABAergic system in cdnf KO fish. A, Colabeling of antiacetylated tubulin (showing axons) and GABA with antibody (showing GABAergic cells) of 8 dpf cdnf WT brains. B, Double immunostaining of 8 dpf cdnf KO brains. C, Quantification of GABA-immunoreactive cell numbers in the PTv, and higher-magnification images of GABA-labeled cells (unpaired t test, t = 9.989, df = 14, p < 0.0001, n = 8/group). D, Quantification of GABA-immunoreactive cell numbers in the Hc, and higher-magnification images of GABA-labeled cells (unpaired t test, t = 5.503, df = 14, p < 0.0001, n = 8/group). E, Quantification of fluorescence intensity of acetylated tubulin-immunoreactive projections, and higher-magnification images of acetylated tubulin-immunoreactive projections (unpaired t test, t = 0.7879, df = 14, p = 0.4439, n = 8/group). White rectangles and arrows represent a noteworthy reduction of GABA-staining cells in the PTv and Hc area, respectively. The marked area was used as an ROI for measurement of fluorescence intensity. Data are mean ± SEM. ***p < 0.001 (Student's t test). Scale bar, 100 µm.

