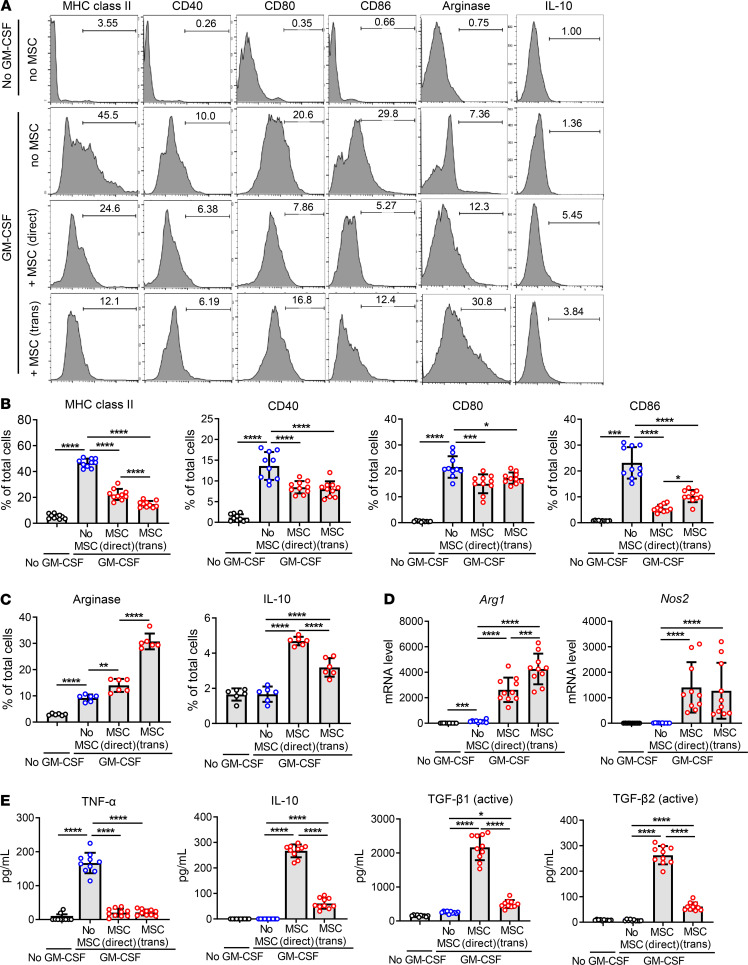
Figure 2. MSCs drive differentiation of BM cells into antiinflammatory phenotypes under inflammatory stimulation.
(A–C) BM cells cocultured with MSCs in direct coculture or Transwell system were stimulated by GM-CSF (40 ng/mL) for 5 days and assayed. Representative flow cytometry histograms (A) and quantitative results for the surface expression of MHC class II, CD40, CD80, and CD86 in BM cells (B) and for the intracellular expression of arginase and IL-10 (C). (D) Real-time RT-PCR assay for Arg1 encoding arginase and Nos2 encoding inducible nitric oxide synthase. Shown are data scaled to BM cells not treated with GM-CSF or cocultured with MSCs. (E) ELISA for TNF-α, IL-10, active TGF-β1, and active TGF-β2 in the cell-free coculture supernatant. Data (mean ± SD) are from 3 independent sets of experiments (n = 2–4 in each group per set. Each biological sample was assayed in 3 technical replicates for RT-PCR and ELISA). A dot depicts data from 1 biological sample. *P < 0.05, **P < 0.01, ***P < 0.001, ****P < 0.0001 by 1-way ANOVA and Tukey’s multiple-comparison test.

