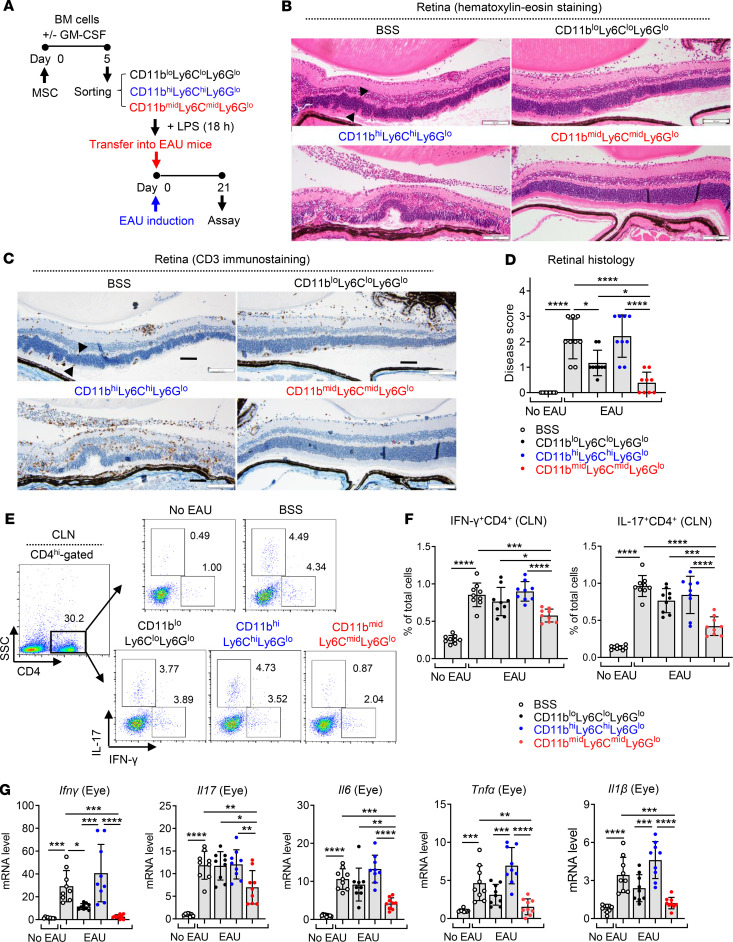
Figure 7. MSC-induced CD11bmidLy6CmidLy6Glo cells protect against EAU development in mice.
(A) The CD11bloLy6CloLy6Glo, CD11bmidLy6CmidLy6Glo, and CD11bhiLy6ChiLy6Glo cells were sorted as in Figure 5A and stimulated with LPS for 18 hours. Each cell population or the vehicle (Hanks balanced salt solution [BSS]) was injected i.v. into mice immediately after EAU induction (day 0). Twenty-one days later (day 21), the mice were sacrificed and assayed. (B–D) Representative microphotographs of H&E staining, CD3 immunostaining of the retinal cross-sections, and disease score assigned by histological findings. The retinal structure, especially outer nuclear layer, including photoreceptor nuclei (arrowheads), was disorganized and infiltrated with inflammatory cells and CD3+ cells in the CD11bhiLy6ChiLy6Glo cell–treated EAU mice. In contrast, the retinal structure was preserved and few inflammatory cells were observed in mice treated with CD11bmidLy6CmidLy6Glo cells. Scale bar: 100 μm. (E and F) Representative flow cytometry cytograms and quantitative results for IFN-γ+CD4+ cells and IL-17+CD4+ cells in draining cervical lymph nodes (CLN). The numbers presented in cytograms (E) represent the percentage of IFN-γ+ or IL-17+ population of CD4+ cells, and the data shown in quantitative graphs (F) are the percentage of IFN-γ+CD4+ cells or IL-17+CD4+ cells of total CLN cells. (G) Real-time RT-PCR analysis for the proinflammatory cytokines in the eye. Shown are the values of mRNA levels relative to those in normal eyes without EAU. A dot indicates data from 1 individual animal (mean ± SD). Each biological sample was assayed in 3 technical replicates for RT-PCR. *P < 0.05, **P < 0.01, ***P < 0.001, ****P < 0.0001 by 1-way ANOVA and Tukey’s multiple-comparison test.

