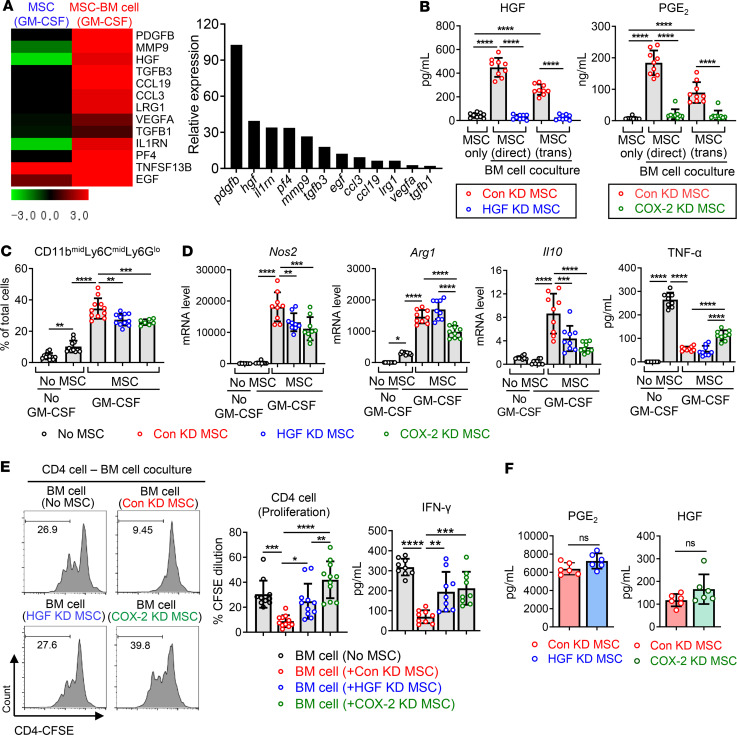
Figure 8. The knockdown of HGF and COX-2 partially reverses the effects of MSCs on BM cell differentiation.
(A) Heatmaps of RNA-Seq on MSCs cultured alone without GM-CSF, MSCs cultured under GM-CSF stimulation, and MSCs cocultured with BM cells under GM-CSF. Presented are the gene expression levels in MSCs cultured with GM-CSF (the first column) and in MSCs cocultured with BM cells + GM-CSF (the second column), relative to those in MSCs cultured without GM-CSF. The genes that encode secreted proteins and were upregulated by >2-fold in MSCs cocultured with BM cells under GM-CSF in comparison with MSCs cultured alone under GM-CSF are listed. The whole data are deposited in ArrayExpress (accession E-MTAB-8976). (B) MSCs were transfected with control siRNA (Con KD MSC), HGF siRNA (HGF KD MSC), or COX-2 siRNA (COX-2 KD MSC) and cocultured with BM cells in either direct or Transwell coculture system (trans) in the presence or absence of GM-CSF. The cell-free culture supernatants were evaluated for the secretion of HGF and PGE2 using ELISA in order to confirm the knockdown of each gene. (C) The flow cytometry results for CD11bmidLy6CmidLy6Glo cells out of BM cells after 5 days of coculture with MSCs. (D) Real-time RT-PCR for mRNA levels of inducible nitric oxide synthase (Nos2), arginase (Arg1), and Il10 in BM cells. ELISA for TNF-α in the cell-free supernatants of BM cell–MSC coculture. (E) BM cells were cocultured with Con KD MSC, HGF KD MSC, or COX-2 KD MSC for 5 days under GM-CSF stimulation. Then, BM cells were separated and cocultured with CFSE-labeled CD4+ cells on anti-CD3 and anti-CD28 antibody–coated plates. After 5 days, CD4+ cell proliferation was evaluated by CFSE dilution assay and IFN-γ secreted level was measured by ELISA. (F) ELISA for PGE2 and HGF in cultures of HGF KD MSC and COX-2 KD MSC, respectively. Three independent sets of experiments in total were performed. Each set contained 2–4 biological samples in each group, and 1 dot depicts data from 1 biological sample. Each biological sample was assayed in 3 technical replicates for RT-PCR and ELISA (mean ± SD). *P < 0.05, **P < 0.01, ***P < 0.001, ****P < 0.0001, ns, not significant. One-way ANOVA and Tukey’s multiple-comparison test were used in B–E and Mann-Whitney test was used in F.

