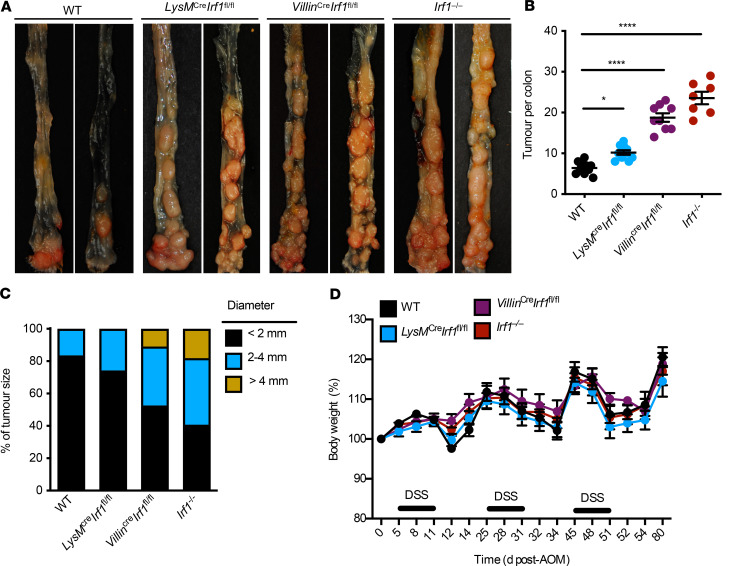
Figure 2. IRF1 functions in both the myeloid and epithelial cell to prevent colitis-associated colorectal tumorigenesis.
(A) Representative images of colon tumors in WT, LysMCreIrf1fl/fl, VillinCreIrf1fl/fl, and Irf1–/– mice 80 days after azoxymethane (AOM) injection. (B) Number of colon tumors in WT (n = 10), LysMCreIrf1fl/fl (n = 10), VillinCreIrf1fl/fl (n = 10), and Irf1–/– (n = 7) mice. (C) Percentage of tumors of various sizes in WT, LysMCreIrf1fl/fl, VillinCreIrf1fl/fl, and Irf1–/– mice 80 days after AOM injection. (D) Body weight change in WT, LysMCreIrf1fl/fl, VillinCreIrf1fl/fl, and Irf1–/– mice 80 days after AOM injection. Each symbol represents 1 individual mouse in B. *P < 0.01; ****P < 0.0001. One-way ANOVA (B) was used. Data are representative of 2 independent experiments. Data are represented as mean ± SEM.

