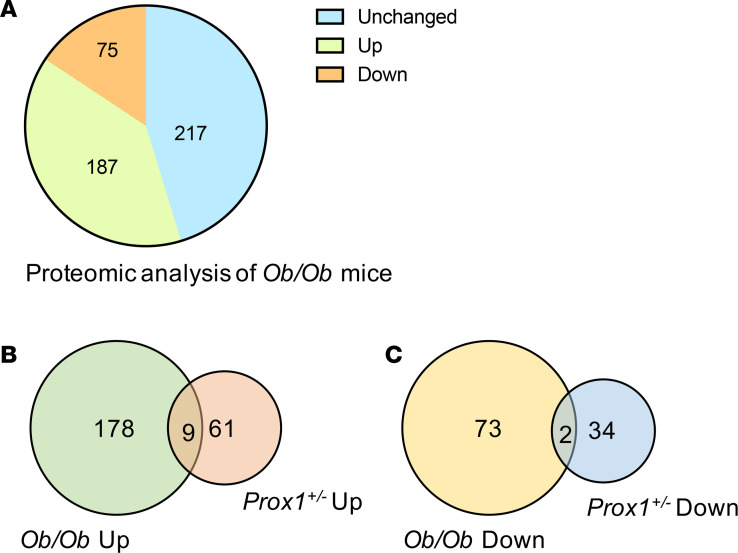
Figure 3. Proteomic analysis of plasma exosomes from ob/ob mice compared with WT controls.
(A) Pie chart shows upregulated and downregulated protein changes in ob/ob mice compared with WT controls. (N = 3.) (B–C) Venn diagram shows the common and unique proteins in Prox1+/– compared with ob/ob mice. The common proteins are presented in red fonts in Figure 2, A and B.

