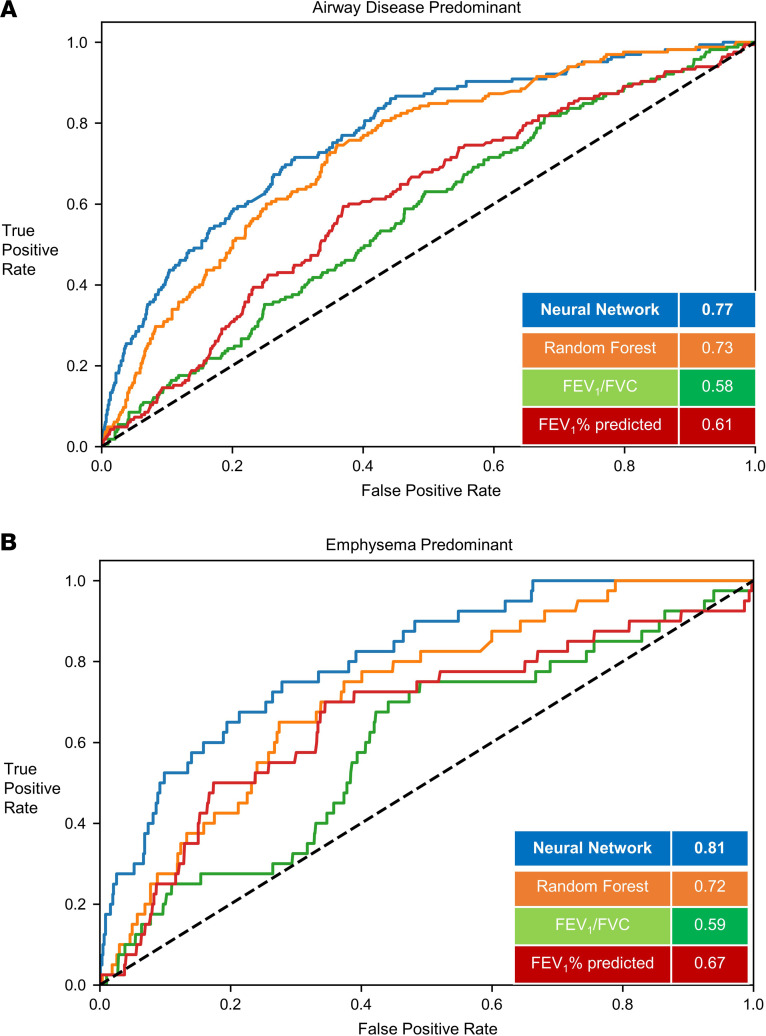
Figure 5. Classification of structural phenotypes — emphysema and small airway disease.
Classification performance of airway disease predominant (A) (emphysema <5% and small airway disease >20%) and emphysema predominant (B) (emphysema >5% and small airway disease <20%) groups. The results show per-class area under the curve (AUC) of the FCN model versus random forest classifier and logistic regression models with FEV1/FVC and FEV1% predicted measurements. Results shown for the hold-out test data set. FEV1, forced expiratory volume in the first second; FVC, forced vital capacity; FCN, fully convolutional network. Small airway disease was defined by parametric response mapping.

