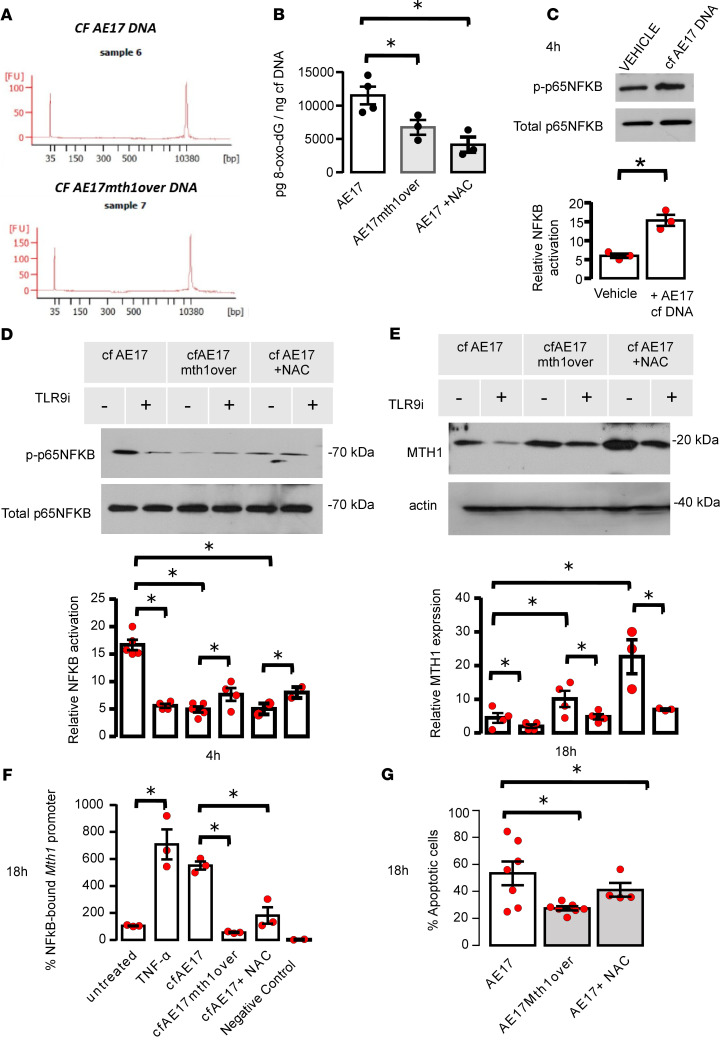
Figure 5. cfDNA of MTH1-overexpressing tumors upregulates MTH1 expression of tumor endothelial cells through TLR9/NF-κB axis and promotes their survival.
(A) AE17 and AE17 MTH1–overexpressing cells secrete large genomic DNA fragments. Nucleic acid isolated from AE17 and AE17 MTH1–overexpressing (AE17mth1over) cell culture supernatants were analyzed by capillary electrophoresis. Representative electropherograms of AE17 (top) and AE17mth1overexpressing cell (bottom) nucleic acids. (B) Oxidative state of cfDNA secreted by AE17 tumor cells is higher than that of AE17 mth1–overexpressing cells. Addition of antioxidant can prevent 8-Oxo-dG incorporation into DNA. cfDNA isolated from cell culture supernatants of AE17 (n = 4), AE17mth1over (n = 3), or AE17 cells treated with NAC (5 mM, overnight) (n = 3) was analyzed for the presence of 8-Oxo-dG by ELISA. Results were normalized to total DNA (ng). (C) cfDNA secreted by AE17 cells activates NF-κB in TECs. Serum-starved TECs were treated with vehicle or cfDNA from AE17 for 4 hours. Phosphorylated and total p65–NF-κB was detected by Western blot. (D) “More oxidized” cfDNA triggers a higher NF-κB activation than “less oxidized” cfDNA, through TLR9. Serum-starved TECs were treated with TLR9i (2 μg/mL) or vehicle for 40 minutes and subsequently treated with 20 ng/mL cfDNA from AE17, AE17 MTH1–overexpressing cells, or AE17 cells treated with NAC for 4 hours. Phosphorylated and total p65–NF-κB was measured by Western blot. (E) cfDNA of MTH1-overexpressing tumor cells upregulates MTH1 of TECs through TLR9. TECs were treated as described in D and analyzed for MTH1 expression by Western blot. (F) NF-κB binds to the endogenous MTH1 promoter of TECs. TECs were treated as C (n = 3). TNF-α (20 ng/mL) was used as a positive control. Binding of NF-κB to MTH1 gene promoter was determined by ChIP assay and Real-time PCR. Results were normalized to the input DNA control. A negative control (NC) (no antibody) was included. (G) TECs were treated as in C, and apoptotic cells were determined upon annexin V–PI staining (AE17, n = 7; AE17mth1over, n = 7; AE17+NAC, n = 4). (C–E) One representative blot of 3 independent experiments. All data are presented as the mean ± SEM. (B, F, G) *P < 0.05 compared with indicated groups by 1-way ANOVA (with Bonferroni’s post hoc test for multiple comparisons). (C, D, E) *P < 0.05 compared with indicated groups by 2-tailed Students’ t test.

