Fig. 4.
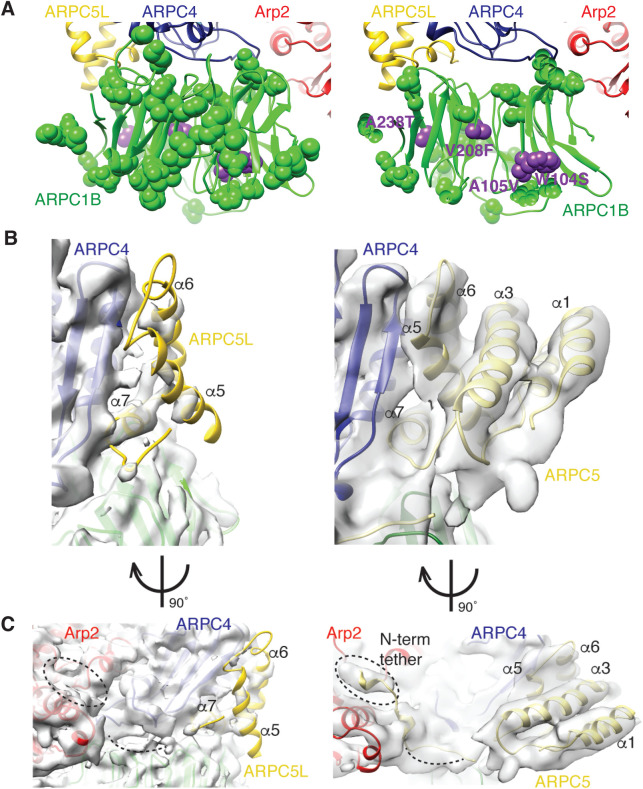
Isoform-mediated differences in human Arp2/3 complexes. (A) Left, location of non-conserved sequence variation between human ARPC1A and ARPC1B (green spheres) and location of disease-causing ARPC1B point mutations (purple spheres) mapped onto ARPC1B; right, cross section through ARPC1B; (B) left, density corresponding to ARPC5L, showing the incomplete density for this subunit apart from helix-α7 adjacent to ARPC4; right, density corresponding to ARPC5, showing the near complete density for this subunit (C) left, 90° rotated view compared to B, left of ARPC5L showing the incomplete density for this subunit and lack of connectivity to Arp2; right, 90° rotated view compared to B, right of ARPC5, showing the clear density for most of the subunit, including its N-terminal tether to Arp2.

