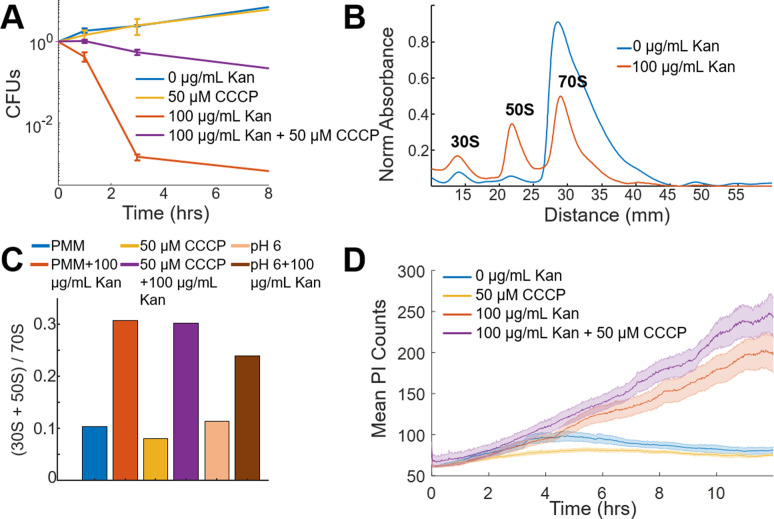
Figure 1. Voltage is not necessary for aminoglycoside uptake or inner membrane pore formation in E. coli but is required for bactericidal activity.
(A) Colony forming units (CFUs) of untreated cells (blue) over four time points compared to cells treated with 50 µM CCCP (yellow), 100 µg/mL kanamycin (orange), and 50 µM CCCP + 100 µg/mL kanamycin (purple). Each curve averages three biological replicates, with mean and standard deviation plotted for each time point. (B) Ribosomal sucrose gradient depth plotted against 254 nm absorbance from LB grown E. coli treated with vehicle (blue), 100 µg/mL kanamycin (orange). The 30S, 50S, and 70S peaks are labeled. (C) Ratio of the area under the curve for the 30S + 50S to 70S peaks from E. coli in PMM pH 7.5, +50 μM CCCP, or pH 6 in the presence or absence of kanamycin. (D) Propidium iodide (3.75 µM in PMM) fluorescence in cells that were untreated (blue), 50 µM CCCP (yellow), 100 µg/mL kanamycin (orange), and 50 µM CCCP + 100 µg/mL kanamycin (purple) treated. The curve is the mean (solid) and standard deviation (shaded) for three biological replicates.


