. 2020 Aug 4;9:e58706. doi: 10.7554/eLife.58706

Figure 2. Voltage and calcium exhibit altered electrophysiological flux in response to aminoglycosides.

(A) Time traces of GCaMP6 fluorescence from single cells treated with 0 µg/mL (blue shades) and 100 µg/mL (orange shades) kanamycin. Individual cells display non-oscillatory transients. (B) The fraction of cells in a population of GCaMP6F expressing cells E. coli experiencing the transients in A at different concentrations of Kanamycin. The mean (line) and standard deviation (error bars) are shown for three biological replicates. (C) The average (solid line) and standard deviation (shading) of the moving GCaMP6f standard deviation (SD) over time from 0 µg/mL (blue) and 100 µg/mL kanamycin (orange) treated cells. (D) TMRM fluorescence from untreated (blue) or kanamycin treated (orange) (100 µg/mL, 2 hr) E. coli measured by cytometry. The average (line) and standard deviation (error bars) of three biological replicates are plotted. (E) The average (solid line) and standard deviation (shading) of the moving GCaMP6f Standard Deviation over time from 100 µg/mL kanamycin-treated cells in the absence (orange) or presence (purple) of 50 µM CCCP.

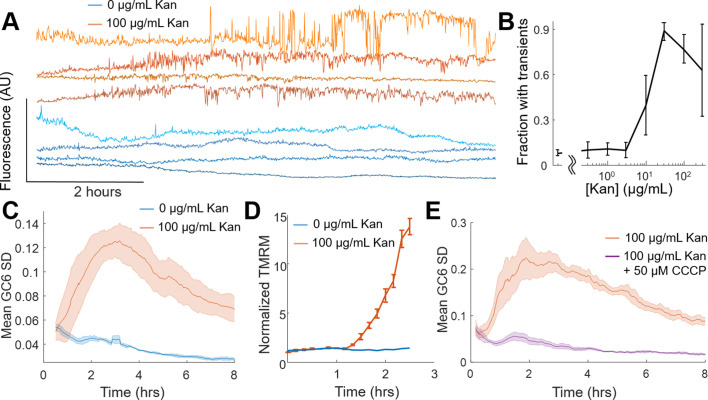
Figure 2.

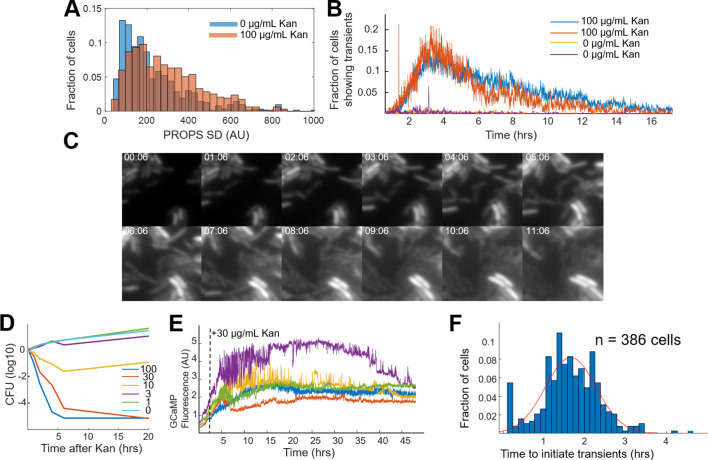
Figure 2—figure supplement 1. Kanamycin induces voltage and calcium transients.

Figure 2—figure supplement 1.

(A) A histogram of the fraction of cells with a given standard deviation of PROPS fluorescence in the absence (blue) and presence (orange) of 100 μg/mL kanamycin. (B,C) Untreated cells have substantially fewer large calcium transients. (B) Fraction of cells exhibiting calcium transients as a function of time for untreated (yellow, purple) compared to treated (red, blue) cells. Each trace represents the mean of biological replicates of > 200 individual cells. Untreated cells do not show any coordinated transients. (C) Strip chart showing the growth of untreated cells. Unlike antibiotic-treated cells under identical imaging conditions, these E. coli cells were able to grow and divide until filling the entire field of view. The time is shown in (HH:MM) format. (D) Survival of cells in liquid culture upon increasing kanamycin concentration in µg/mL, measured by CFUs at indicated dose and time. Each curve averages three biological replicates. (E) Kanamycin-treated cells are capable of exhibiting transients for at least 48 hr. Time traces of GCaMP6 fluorescence from individual cells. Each color represents the mean fluorescence from a single cell. The black dotted line represents the addition of 30 µg/mL kanamycin. The majority of calcium transients occur within the first 12 hr after treatment, but individual cells still show activity even up to 48 hr after treatment. (F) Histogram shows the time of the first transient for cells that had transients. The population fit to a Gaussian with a peak of 1.64 hr after kanamycin addition.
Figure 2—figure supplement 2. Calculating moving standard deviation from treated cells.

Figure 2—figure supplement 2.

(A) Top - GCaMP6 intensity traces from single cells marked by different colors under no external antibiotic concentrations. Bottom – Moving standard deviation traces from the same cells in the top, where the same color indicates the standard deviation from that cell. The fluorescence changes were transformed to the GCaMP6f moving standard deviation by first normalizing by dividing by a 45 min moving median. Then the moving standard deviation was calculated from the normalized trace using a 30 min sliding window, the output of which is shown here. (B) The same as in part A, except cells were treated with 100 μg/mL kanamycin. (C) Mean of the moving standard deviations from the untreated (blue) or kanamycin-treated (orange) populations. The solid line indicates the mean, and the shaded error bars indicate the standard deviation at each time point.
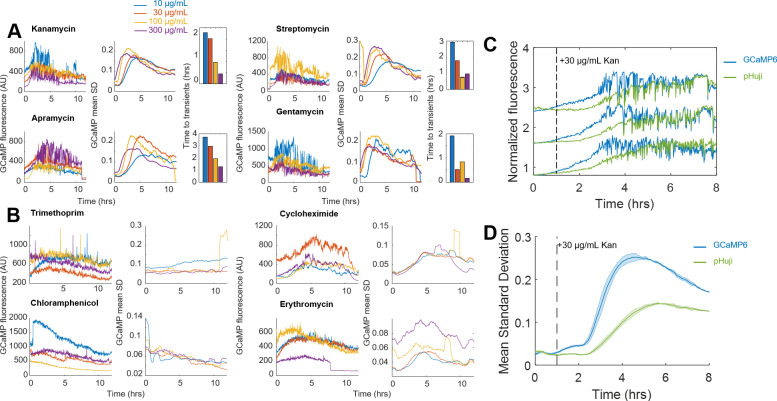
Figure 2—figure supplement 3. Only aminoglycosides induce calcium transients.

Figure 2—figure supplement 3.

(A) All aminoglycosides tested (kanamycin, streptomycin, apramycin, gentamicin) exhibit calcium transients in a concentration dependent fashion. For each compound tested, the fraction of cells exhibiting transients increased, while the time of transient onset decreased with increasing concentration of aminoglycoside treatment. Each three panel set of the compounds; Kanamycin, Streptomycin, Apramycin, and Gentamicin: (left) representative GCaMP6 time traces at 100 µg/mL compound, (middle) the mean GCaMP6 standard deviation of the population, and (right) the mean of the Gaussian fit for the onset of transients for a population as a function of treatment concentration. (B) Antibiotics that are not aminoglycosides did not induce catastrophic calcium transients in any fashion. For trimethoprim, cyclohexamide, chloramphenicol, and erythromycin, representative traces of individual cells are shown at a treatment of 100 µg/mL (Left). The mean GCaMP6 standard deviation for the population is shown across a titration of each antibiotic (right). Each trace is the mean of two biological replicates. (C) Single-cell traces over time of pHuji (green) + GCaMP6f (blue) expressing cells treated with 30 μg/mL kanamycin. (D) Mean moving standard deviation plots of populations of cells represented in C. Dashed line represents addition of aminoglycoside treatment.
Figure 2—figure supplement 4. High pH is necessary to induce calcium transients.

Figure 2—figure supplement 4.

(A) The average of the moving SD from a population of cells at pH 5.95 and pH 7.99, either treated with 0 or 100 µg/mL kanamycin. Each curve averages three biological replicates. Shading around the line is the standard deviation. (B) Mean (line) and standard deviation (error bars) of TMRM fluorescence of cells over time measured by cytometry in 200 nM TMRM in PMM. E. coli in pH 6.0 in the absence (green) or presence (magenta) of 10 µg/mL gentamicin were compared to E. coli at pH 7.5 in the absence (blue), and presence (orange) of 10 µg/mL gentamicin. (C) The average of the moving SD from a population of cells treated with 10 µg/mL gentamicin that were WT (blue), nuoA::kanR (orange), nuoB::kanR (yellow), and nuoI::kanR (purple) strains. Each curve averages three biological replicates. Shading around the line is the standard deviation.