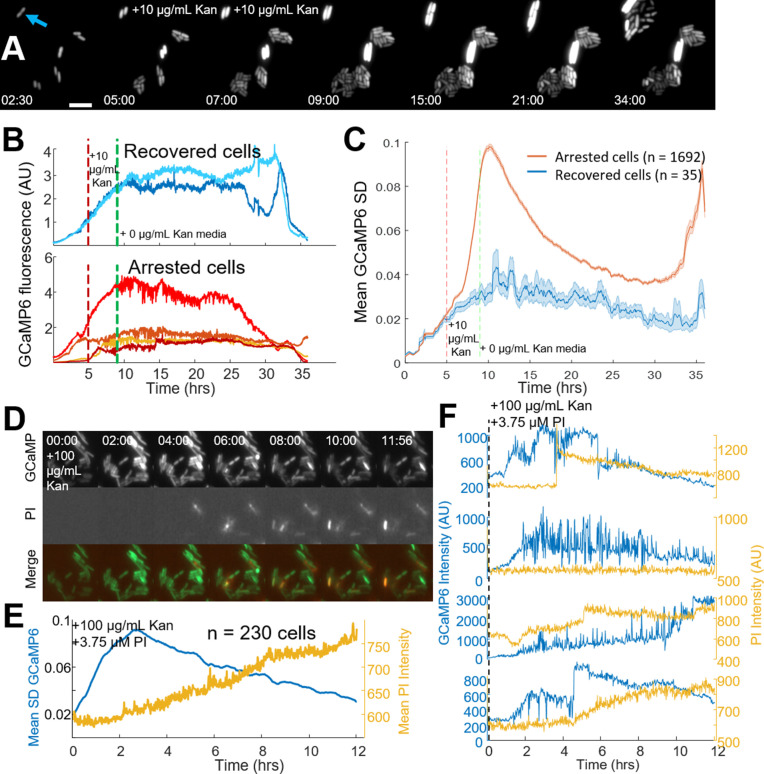
Figure 3. Single-cell calcium flux predicts cellular aminoglycoside response.
(A) Strip chart of cells expressing GCaMP6f. Cells were imaged in PMM alone for 5 hr, then exposed to 10 µg/mL kanamycin for 4 hr. After 4 hr, PMM alone was flowed in for an additional 26 hr. The blue arrow indicates a cell that was able to divide after treatment with kanamycin, 5 µm scale bar. Time is shown in (HH:MM) format. (B) Individual GCaMP6 time traces from cells that regrow after treatment compared to a random selection of cells that do not regrow within 24 hr. (C) The average (line) and standard deviation (shaded region) of the moving SD from all cells that regrow (blue) vs those that do not regrow (red). (D) Strip chart showing GCaMP6 fluorescence (top), propidium iodide fluorescence (middle), and the merge. Cells were treated with 100 µg/mL kanamycin at time t = 0. Time is shown in (HH:MM) format. (E) The mean GCaMP6 standard deviation for the population is shown in blue. Yellow shows the population average of the PI fluorescence. (F) Time traces of individual cells showing the GCaMP6 fluorescence (blue) and the PI fluorescence (yellow) on the same cells. The PI fluorescence was not correlated with the onset of transients, although many cells did uptake PI during the course of the experiment.


