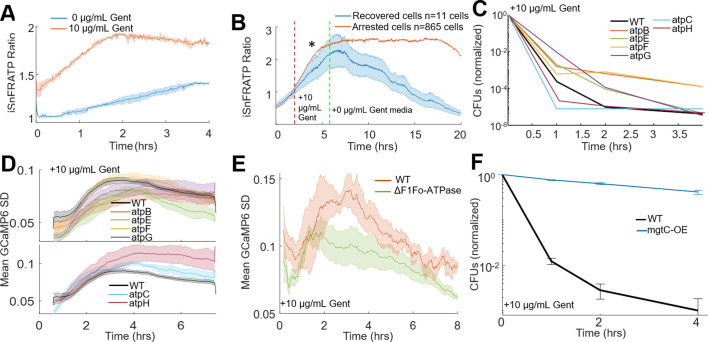
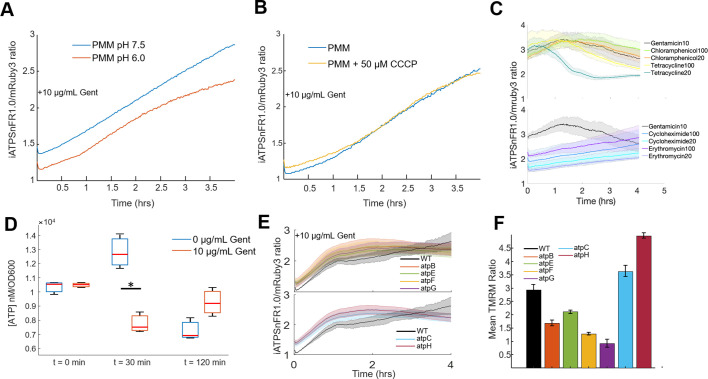
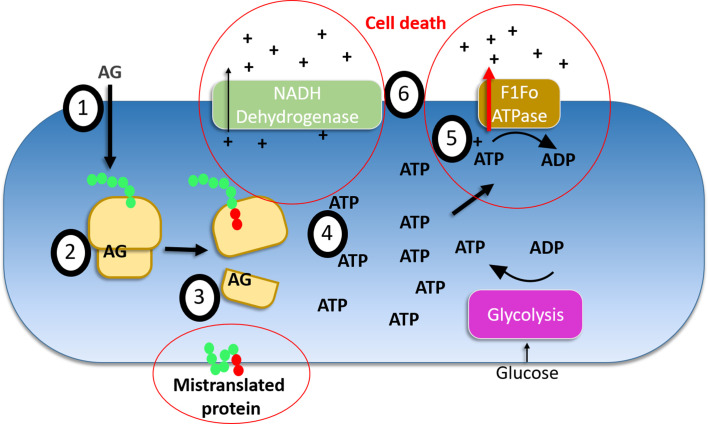
Figure 5. ATP dysregulation precedes voltage-induced bactericidal killing.
(A) iATPSnFR ratios from E. coli treated with vehicle (blue) or 10 µg/mL gentamicin (orange). The ratio of iATPSnFR (488 nm) to mRuby (561 nm) indicates ATP concentration. Each trace averages two biological replicates. (B–F) Cells treated with 10 µg/mL gentamicin. (B) iATPSnFR ratios from gentamicin-treated cells that do (blue) or do not (orange) regrow. The star represents a significance of < 0.05 tested at 2 hr after treatment using a student t-test with unequal variance. (C) Normalized CFUs of gentamicin-treated knockouts of components of the F1Fo-ATPase compared to WT. Each data point is in biological triplicate. (D) Mean moving GCaMP6f SD for gentamicin-treated F1Fo-ATPase component knockouts compared to WT. Each curve averages four biological replicates. (E) Mean moving GCaMP6f SD for gentamicin-treated E. coli strain DK8, missing all components of the F1Fo-ATPase compared to WT. Each curve averages four biological replicates. (F) Normalized CFUs of gentamicin-treated mgtC expressing E. coli compared to WT.


