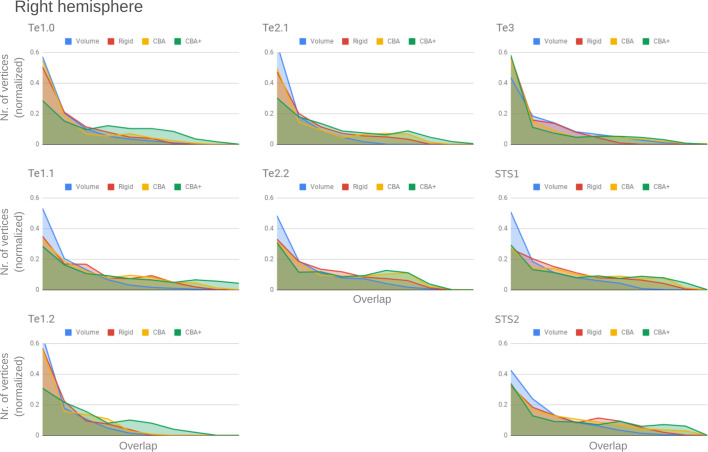
Figure 9. Histograms of the overlap across cytoarchitectonic areas in the right hemisphere.
The histograms are normalized by the number of vertices per area. The x-axis represents the probability value (an overlap from 1 out of 10 [left] to 10 out of 10 participants [right]). The ideal co-registration method should show less left skewed distribution. CBA+ shows the lowest skew toward the left in comparison to other methods.

