. 2020 Jul 10;9:e56782. doi: 10.7554/eLife.56782

Figure 5. PDAC cancer cells have higher pyruvate carboxylation activity in vivo.

(A–B) Tumors from LSL-KrasG12D/+; Trp53fl/fl; Pdx1-Cre; LSL-tdTomato (KP-/-CT) mice were stained with antibodies against RFP (red) and (A) α-SMA (green), a fibroblast marker, or (B) CK19 (green), a cancer cell marker. Scale bars represent 25 μm. (C) A representative flow cytometry plot showing CD45 and tdTomato expression in cells derived from a PDAC tumor arising in KP-/-CT mice. Cells were gated on the live population. (D) Expression of tdTomato was measured by qPCR in sorted cells from KP-/-CT PDAC tumors. The difference in expression between cancer cells and whole tumor (p=0.0430), fibroblasts (p=0.0156), or hematopoietic cells (p=0.0119) was significant based on unpaired, two-tailed student’s t-tests. Mean +/- SEM is shown. n = 6 mice. 18S was used as a housekeeping gene control. (E) Expression of α-SMA was measured by qPCR in sorted cells from KP-/-CT PDAC tumors. The difference in expression between fibroblasts and whole tumor (p=0.0004), cancer cells (p=0.0013), or hematopoietic cells (p=0.0003) was significant based on unpaired, two-tailed student’s t-tests. Mean +/- SEM is shown. n = 6 mice. 18S was used as a housekeeping gene control. (F) Expression of CD3ε was measured by qPCR in sorted cells from KP-/-CT PDAC tumors. The difference in expression between hematopoietic cells and whole tumor was not significant (p=0.3347), but the difference between hematopoietic cells and cancer cells (p=0.0378) or fibroblasts (p=0.0379) was significant based on unpaired, two-tailed student’s t-tests. Mean +/- SEM is shown. n = 6 mice. 18S was used as a housekeeping gene control. (G) Fractional labeling of aspartate from protein hydrolysates from intact PDAC tumors following a 24 hr U-13C-glucose infusion at a rate of 30 mg/kg/min. n = 4. Mean +/- SEM is shown. (H) Fractional labeling of aspartate from protein hydrolysates from the indicated sorted cell populations from tumors arising in KP-/-CT mice following a 24 hr U-13C-glucose infusion at a rate of 30 mg/kg/min. The M+3 isotopomers are shown. The differences in M+3 aspartate labeling in cancer cells compared to fibroblasts (p=0.0413) and hematopoietic cells (p=0.0005) were significant, and the difference between cancer cells and unsorted tumor cells (p=0.0612) was not significant based on unpaired, two-tailed student’s t-tests. Mean +/- SEM is shown. n = 5 mice. (I) Fractional labeling of aspartate from protein hydrolysates from the indicated sorted cell populations from tumors arising in KP-/-CT mice following a 24 hr U-13C-glucose infusion at a rate of 30 mg/kg/min. The M+2 isotopomers are shown. The differences in M+2 aspartate labeling in cancer cells compared to fibroblasts (p=0.0309) and hematopoietic cells (p=0.0035) were significant, and the difference between cancer cells and unsorted tumor cells (p=0.7444) was not significant based on unpaired, two-tailed student’s t-tests. Mean +/- SEM is shown. n = 5 mice.
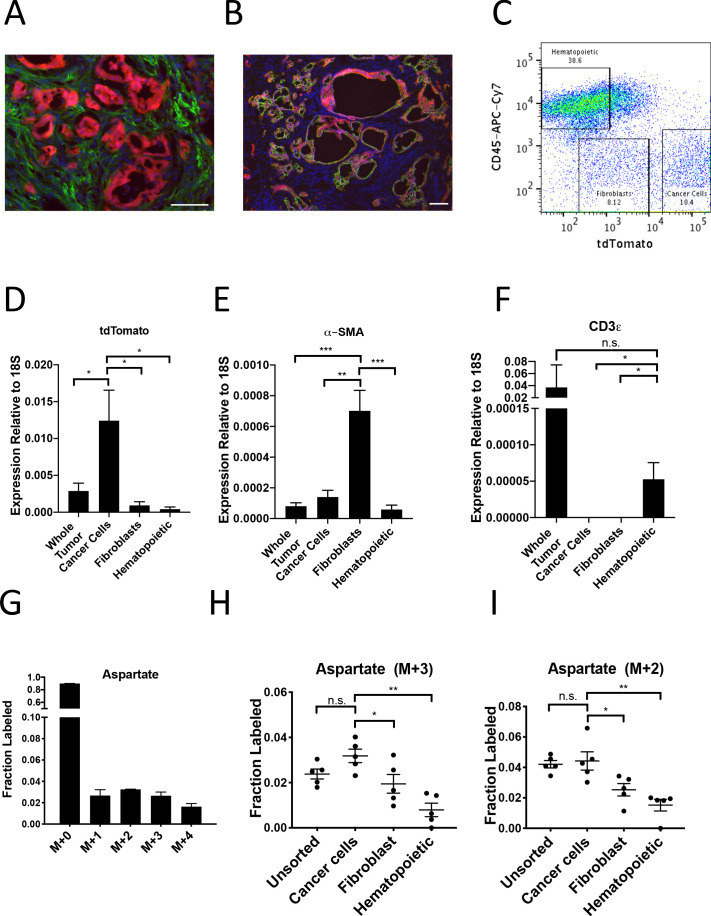
Figure 5—source data 1. Isotope labeling of protein hydrolysates in mice with autochthonous PDAC tumors after 24 hr of U-13C- glucose infusion and sorting.

Figure 5.

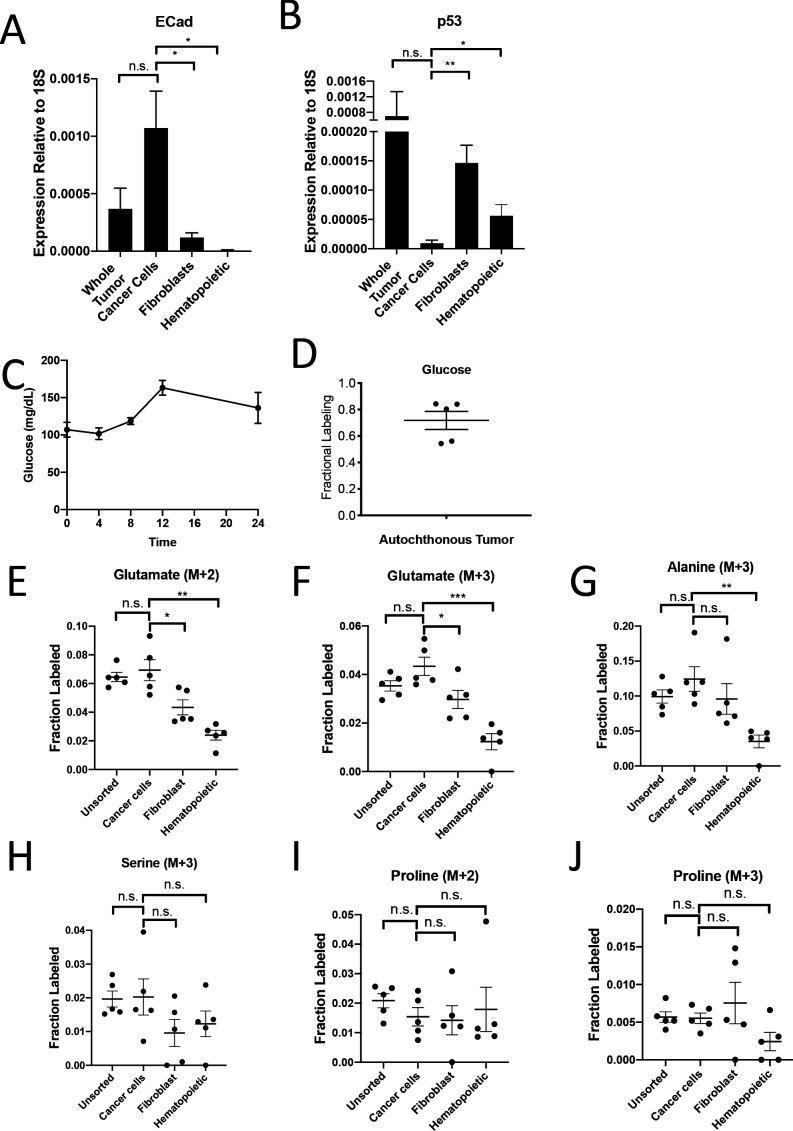
Figure 5—figure supplement 1. PDAC cancer cells have higher pyruvate carboxylation activity in vivo.

Figure 5—figure supplement 1.

(A) Expression of E-Cadherin was measured by qPCR in sorted cells from KP-/-CT PDAC tumors. The difference in expression between cancer cells and whole tumor was not significant (p=0.0765), but the difference between cancer cells and fibroblasts (p=0.0106) or hematopoietic cells (p=0.0051) was significant based on unpaired, two-tailed student’s t-tests. n = 6 mice. Mean +/- SEM is shown. 18S was used as a housekeeping gene control. (B) Expression of p53 was measured by qPCR in sorted cells from KP-/-CT PDAC tumors. The difference in expression between cancer cells and whole tumor was not significant (p=0.2910), but the difference between cancer cells and fibroblasts (p=0.0006) or hematopoietic cells (p=0.0206) was significant based on unpaired, two-tailed student’s t-tests. n = 6 mice. Mean +/- SEM is shown. 18S was used as a housekeeping gene control. (C) Blood glucose levels over time in mice infused with U-13C-glucose for 24 hr at a rate of 30 mg/kg/min. n = 4. Mean +/- SEM is shown. (D) Enrichment of fully labeled glucose (M+6) in plasma from mice following a 24 hr U-13C-glucose infusion at a rate of 30 mg/kg/min. n = 5. Mean +/- SEM is shown. (E) Fractional labeling of M+2 glutamate from protein hydrolysates from sorted cell populations from tumors from KP-/-CT mice following a 24 hr U-13C-glucose infusion at a rate of 30 mg/kg/min. The differences in M+2 glutamate labeling in cancer cells compared to fibroblasts (p=0.0208) and hematopoietic cells (p=0.0005) were significant, and the difference between cancer cells and unsorted tumor cells (p=0.5667) was not significant based on unpaired, two-tailed student’s t-tests. Mean +/- SEM is shown. n = 5 mice. (F) Fractional labeling of M+3 glutamate from protein hydrolysates from sorted cell populations from tumors from KP-/-CT mice following a 24 hr U-13C-glucose infusion at a rate of 30 mg/kg/min. The differences in M+3 glutamate labeling in cancer cells compared to fibroblasts (p=0.0323) and hematopoietic cells (p=0.0003) were significant, and the difference between cancer cells and unsorted tumor cells (p=0.0994) was not significant based on unpaired, two-tailed student’s t-tests. n = 5 mice. Mean +/- SEM is shown. (G) Fractional labeling of M+3 alanine from protein hydrolysates from sorted cell populations from tumors from KP-/-CT mice following a 24 hr U-13C-glucose infusion at a rate of 30 mg/kg/min. The differences in M+3 alanine labeling in cancer cells compared to fibroblasts (p=0.3415) or unsorted tumor cells (p=0.2448) were not significant, but the difference between labeling in cancer cells and hematopoietic cells (p=0.0020) was significant based on unpaired, two-tailed student’s t-tests. n = 5 mice. Mean +/- SEM is shown. (H) Fractional labeling of M+3 serine from protein hydrolysates from sorted cell populations from tumors from KP-/-CT mice following a 24 hr U-13C-glucose infusion at a rate of 30 mg/kg/min. The differences in M+3 serine labeling in cancer cells compared to fibroblasts (p=0.1499), hematopoietic cells (p=0.2590), and unsorted tumor cells (p=0.9210) were not significant based on unpaired, two-tailed student’s t-tests. n = 5 mice. Mean +/- SEM is shown. (I) Fractional labeling of M+2 proline from protein hydrolysates from sorted cell populations from tumors from KP-/-CT mice following a 24 hr U-13C-glucose infusion at a rate of 30 mg/kg/min. The differences in M+2 proline labeling in cancer cells compared to fibroblasts (p=0.8450), hematopoietic cells (p=0.7661), and unsorted tumor cells (p=0.2039) were not significant based on unpaired, two-tailed student’s t-tests. n = 5 mice. Mean +/- SEM is shown. (J) Fractional labeling of M+3 proline from protein hydrolysates from sorted cell populations from tumors from KP-/-CT mice following a 24 hr U-13C-glucose infusion at a rate of 30 mg/kg/min. The differences in M+3 proline labeling in cancer cells compared to fibroblasts (p=0.4966), hematopoietic cells (p=0.0576), and unsorted tumor cells (p=0.8742) were not significant based on unpaired, two-tailed student’s t-tests. n = 5 mice. Mean +/- SEM is shown.