. 2020 Jul 10;9:e56782. doi: 10.7554/eLife.56782

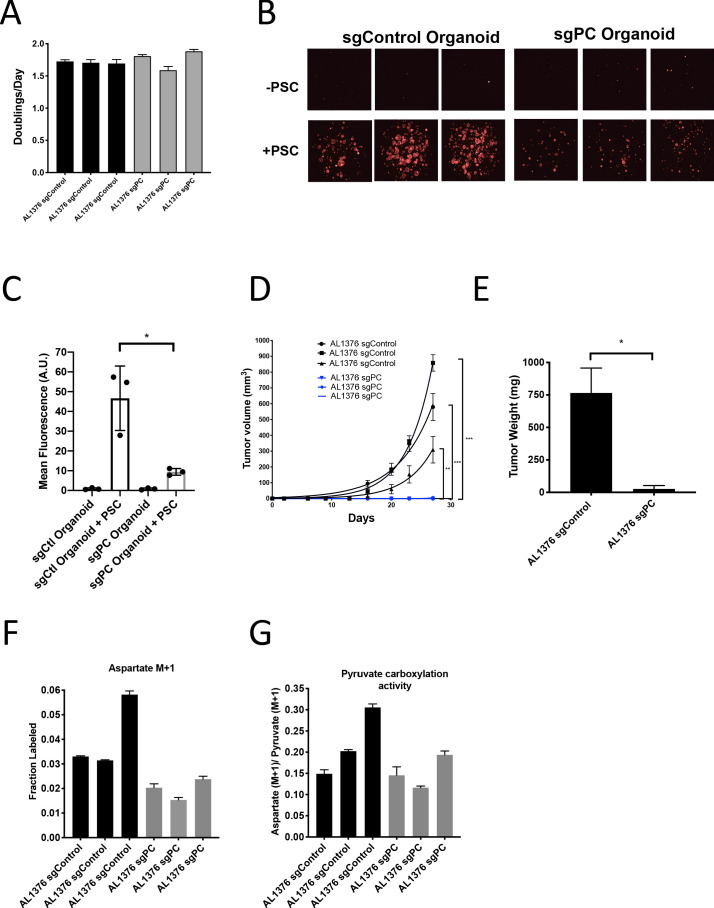
Figure 6. Pyruvate carboxylase in cancer cells is required for PDAC tumor growth in vivo.

(A) Proliferation rate of AL1376 murine PDAC cells without (sgControl) or with (sgPC) deletion in standard 2D culture. Mean +/- SD is shown. (B) Fluorescent images of murine PDAC cancer cell organoids expressing tdTomato without (sgControl) or with (sgPC) deletion cultured in DMEM-pyruvate with 10% dialyzed FBS alone (top) or with murine PSCs (bottom). (C) Quantification of tdTomato fluorescence from images in (B). Control organoids with PSCs had significantly higher tdTomato fluorescence than sgPC organoids grown with PSCs (p=0.0171) based on an unpaired, two-tailed student’s t-test. Mean +/- SD is shown. (D) Growth of sgControl (black) and sgPC (blue) AL1376 murine PDAC cells as tumors following subcutaneous transplantation into syngeneic Bl6 mice. The final tumor volume is significantly greater in sgControl AL1376 cells compared to sgPC cells based on unpaired, two-tailed student’s t-tests (p<0.0001 to 0.0049). Mean +/- SEM is shown. n = 6 for each group. (E) Growth of sgControl and sgPC AL1376 murine PDAC cells as tumors after orthotopic transplantation into the pancreas of syngeneic Bl6 mice. Tumor weight was measured after 21 days and was significantly greater in mice transplanted with sgControl cells based on an unpaired, two-tailed student’s t-test (p=0.0050). Mean +/- SEM is shown. n = 5 mice for each group. (F) Fractional labeling of aspartate in sgControl and sgPC AL1376 murine PDAC cells after 24 hr of culture with 1-13C-pyruvate. Mean +/- SD is shown. (G) Aspartate M+1 isotopomer labeling from (F) was normalized to pyruvate M+1 labeling as a surrogate for pyruvate carboxylation activity. Mean +/- SD is shown.

Figure 6.

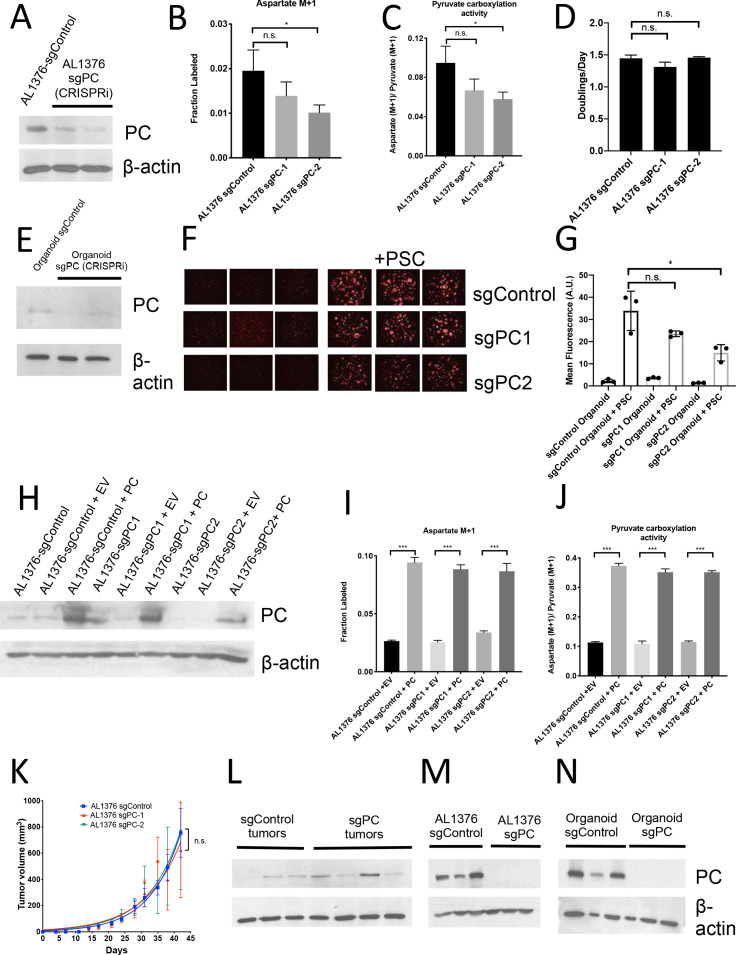
Figure 6—figure supplement 1. Pyruvate carboxylase in cancer cells is required for PDAC tumor growth in vivo.

Figure 6—figure supplement 1.

(A) Western blot for PC expression levels in AL1376 murine sgPC PDAC cell lines compared to sgControl cell lines made using CRISPRi using β-actin as a control. (B) Fractional labeling of aspartate M+1 following 24 hr of 1-13C-pyruvate tracing in AL1376 murine sgPC PDAC cell lines compared to sgControl cell lines. The difference in labeling between AL1376 sgControl cells and sgPC-1 cells (p=0.1564) was not significant and the difference in labeling between AL1376 sgControl cells and sgPC-2 cells (p=0.0304) was significant based on unpaired, two-sided student’s t tests. Mean +/- SD is shown. (C) Aspartate M+1 isotopomer labeling from (B) was normalized to pyruvate M+1 labeling as a surrogate for pyruvate carboxylation activity following 24 hr of 1-13C-pyruvate tracing. The difference in pyruvate carboxylation activity between AL1376 sgControl cells and sgPC-1 cells (p=0.0782) was not significant and the difference in pyruvate carboxylation activity between AL1376 sgControl cells and sgPC-2 cells (p=0.0260) was significant based on unpaired, two-sided student’s t tests. Mean +/- SD is shown. (D) Proliferation rate of sgControl and sgPC AL1376 knockdown murine PDAC cell lines generated using CRISPRi over 3 days in DMEM with 10% FBS. Differences in proliferation between AL 1376 sgControl cells and sgPC-1 (p=0.0609) or sgPC-2 (p=0.7585) cells were not significant based on unpaired, two-sided student’s t tests. Mean +/- SD is shown. (E) Western blot analysis of PC expression levels in sgPC knockdown PDAC organoids compared to sgControl organoids made using CRISPRi using β-actin as a control. (F) Fluorescent images of sgControl or sgPC knockdown murine PDAC organoids cultured in DMEM-pyruvate with 10% dialyzed FBS alone (left) or with murine PSCs (right). (G) Quantification of tdTomato fluorescence from images in (F). sgControl organoids with PSCs trended towards higher tdTomato fluorescence compared to sgPC-1 organoids with PSCs (p=0.1166) and had significantly higher tdTomato fluorescence than sgPC-2 organoids with PSCs (p=0.0272) based on unpaired, two-tailed student’s t-tests. Mean +/- SD is shown. (H) Western blot for PC expression levels in AL1376 murine sgPC knockdown and PC overexpression PDAC cell lines compared to sgControl cell lines using β-actin as a control. (I) Fractional labeling of aspartate M+1 following 24 hr of 1-13C-pyruvate tracing in AL1376 murine sgPC and PC rescue PDAC cell lines compared to sgControl cell lines made using CRISPRi. Labeling is significantly increased in AL1376 sgControl + PC cells compared to sgControl + EV cells (p<0.0001), AL1376 sgPC1 + PC cells compared to sgPC + EV cells (p<0.0001), and AL1376 sgPC2 + PC cells compared to sgPC2 + EV cells (p=0.0002). Mean +/- SD is shown. (J) Aspartate M+1 isotopomer labeling from (I) was normalized to pyruvate M+1 labeling as a surrogate for pyruvate carboxylation activity following 24 hr of 1-13C-pyruvate tracing. Pyruvate carboxylation activity is significantly increased in AL1376 sgControl + PC cells compared to sgControl + EV cells (p<0.0001), AL1376 sgPC1 + PC cells compared to sgPC + EV cells (p<0.0001), and AL1376 sgPC2 + PC cells compared to sgPC2 + EV cells (p<0.0001). Mean +/- SD is shown. (K) Growth of sgControl (blue) or sgPC knockdown (red and green) AL1376 murine PDAC cell lines after subcutaneous transplantation into syngeneic Bl6 mice. There is no significant difference in final tumor volume between sgControl AL1376 cells and sgPC1 cells (p=0.7577) and between sgControl AL1376 cells and sgPC2 cells (p=0.9830) cells based on unpaired, two-tailed student’s t-tests. Mean +/- SEM is shown. n = 6 for each group. (L) Western blot showing PC expression in whole tumor lysates from tumors formed from sgControl or sgPC AL1376 knockdown cells after subcutaneous transplantation from (K). (M) Western blot analysis of PC expression levels in single-cell cloned sgPC knockout PDAC cells compared to sgControl clones using β-actin as a control. (N) Western blot analysis of PC expression levels in single-cell cloned sgPC knockout PDAC organoids compared to sgControl organoids using β-actin as a control.
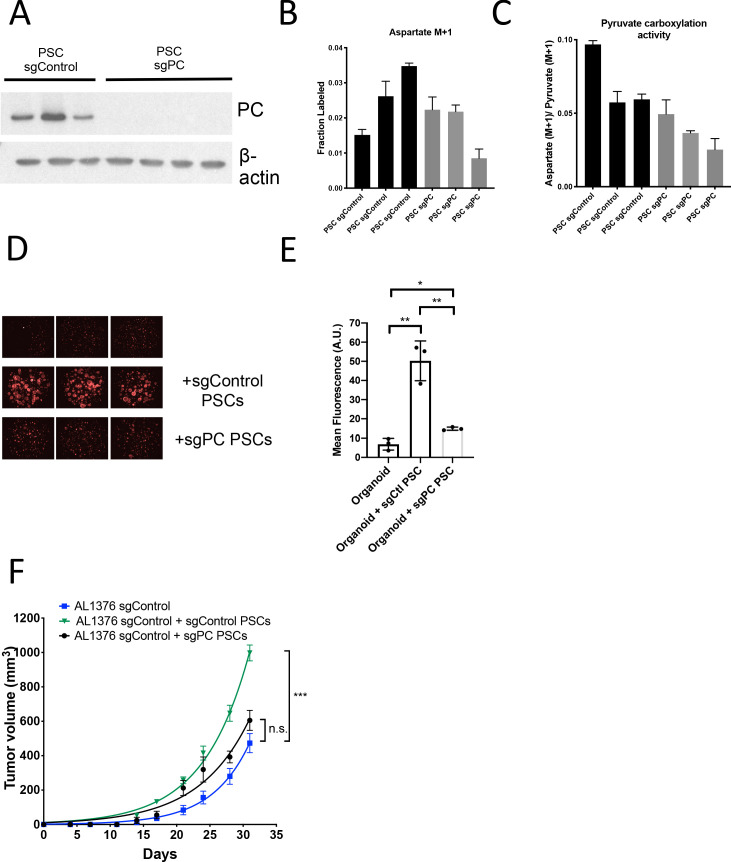
Figure 6—figure supplement 2. Pyruvate carboxylase knockout PSCs retain ability to enhance PDAC growth.

Figure 6—figure supplement 2.

(A) Western blot analysis of PC expression levels in single-cell cloned sgPC knockout PSCs compared to sgControl clones using β-actin as a control. (B) Fractional labeling of aspartate M+1 following 24 hr of 1-13C-pyruvate tracing in sgPC PSC cell lines compared to sgControl cell lines. Mean +/- SD is shown. (C) Aspartate M+1 isotopomer labeling from (P) was normalized to pyruvate M+1 labeling as a surrogate for pyruvate carboxylation activity following 24 hr of 1-13C-pyruvate tracing. Mean +/- SD is shown. (D) Fluorescent images of murine PDAC organoids cultured in DMEM-pyruvate with 10% dialyzed FBS alone (top), with murine sgControl PSCs (middle), or with murine sgPC PSCs (bottom). (E) Quantification of tdTomato fluorescence from images in (R). The differences in tdTomato fluorescence between organoids alone and organoids with sgControl PSCs (0.0023), organoids alone and organoids with sgPC PSCs (p=0.0122), and organoids with sgControl PSCs and organoids with sgPC PSCs (p=0.0041) are significant based on unpaired, two-tailed student’s t-tests. Mean +/- SD is shown. (F) Growth of sgControl AL1376 murine PDAC cell lines alone (blue), with sgControl PSCs (green), or sgPC PSCs (black) after subcutaneous transplantation into syngeneic Bl6 mice. There is no significant difference in final tumor volume between sgControl AL1376 cells and sgControl AL1376 cells co-injected with sgPC PSCs (p=0.1313), but differences are significant at intermediate time points. The difference in final tumor volume is significant between sgControl AL1376 cells and sgControl AL1376 cells with sgControl PSCs (p<0.0001), based on unpaired, two-tailed student’s t-tests. Mean +/- SEM is shown. n = 6 for each group.