. 2020 Jul 10;9:e56782. doi: 10.7554/eLife.56782

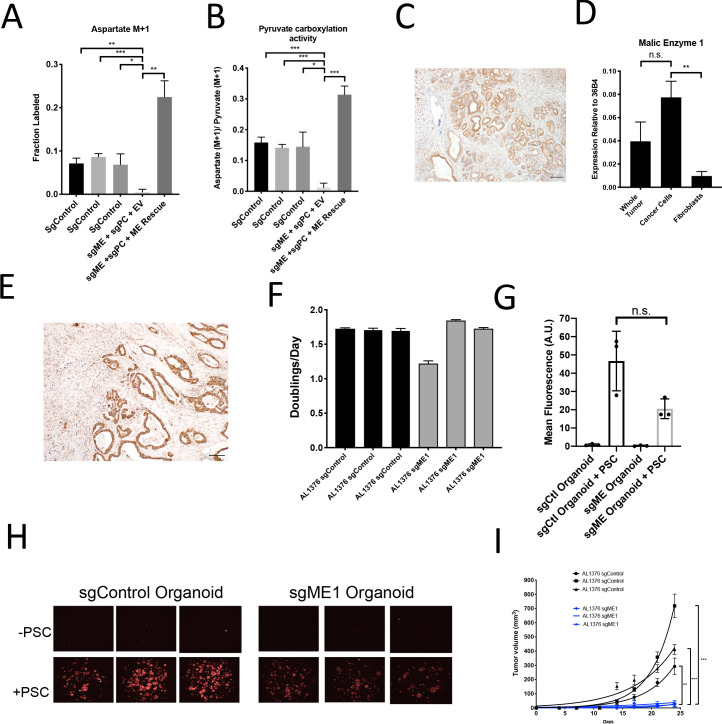
Figure 7. Malic enzyme 1 contributes to pyruvate carboxylation activity in PDAC cells and is important for tumor growth.

(A–B) CRISPR/Cas9 was used to disrupt PC and/or ME1 as indicated in AL1376 murine PDAC cells. (A) Fractional labeling of M+1 aspartate following culture of the indicated cells for 24 hr in media containing 1-13C-pyruvate. M+1 aspartate labeling was significantly decreased in double knockout cells compared to control cells (p=0.0012, 0.0001, and 0.0131) or to double knockout cells with exogenous ME1 expression (ME rescue) (p=0.0006) based on unpaired, two-tailed student’s t-tests. Mean +/- SD is shown. (B) Aspartate M+1 isotopomer labeling was normalized to pyruvate M+1 labeling as a surrogate for pyruvate carboxylation activity following 24 hr of 1-13C-pyruvate tracing. Pyruvate carboxylation activity was significantly decreased in double knockout cells compared to control cell lines (p=0.0004, 0.0002, and 0.0100) or to double knockout cells with exogenous ME1 expression (ME rescue) (p<0.0001) based on unpaired, two-tailed student’s t-tests. Mean +/- SD is shown. (C) Sections from tumors arising in LSL-KrasG12D/+; Trp53fl/fl; Pdx1-Cre (KP-/-C) mice were stained with an antibody against ME1. Scale bar represents 100 μm. (D) Expression of ME1 was measured by qPCR in the indicated cells sorted from tumors arising in KP-/-C mice. The expression of ME1 was not significantly different in sorted cancer cells compared to the whole tumor (p=0.1114), but was significantly higher in sorted cancer cells compared to fibroblasts (p=0.0009) based on unpaired, two-tailed student’s t-tests. Mean +/- SEM is shown. 36B4 was used as a housekeeping gene control. (E) Representative image from a human pancreatic tumor tissue microarray stained with an antibody against ME1. Scale bar represents 100 μm. (F) Proliferation rate of sgControl and sgME1 AL1376 murine PDAC cells in standard 2D culture. (G) Quantification of tdTomato fluorescence from images of sgControl or sgME1 PDAC cancer cell organoids isolated from KP-/-CT tumors cultured in DMEM-pyruvate with 10% dialyzed FBS alone or with murine PSCs. sgControl organoids with PSCs trended towards higher tdTomato fluorescence compared to sgME1 organoids with PSCs (p=0.0579) but was not significant based on an unpaired, two-tailed student’s t-test. Mean +/- SD is shown. The sgControl data are also shown in Figure 6B–C. (H) Fluorescent images of sgControl or sgME1 PDAC cancer cell organoids cultured DMEM-pyruvate with 10% dialyzed FBS alone (top) or with murine PSCs (bottom). The sgControl images are also shown in Figure 6B–C. (I) Growth of sgControl (black) and sgME1 (blue) AL1376 murine PDAC cells as tumors following subcutaneous transplantation into syngeneic B6 mice. The final tumor volume is significantly greater in sgControl AL1376 cells compared to sgME1 cells based on unpaired, two-tailed student’s t-tests (p<0.0001 to 0.0017). Mean +/- SEM is shown. n = 6 for each group.

Figure 7.

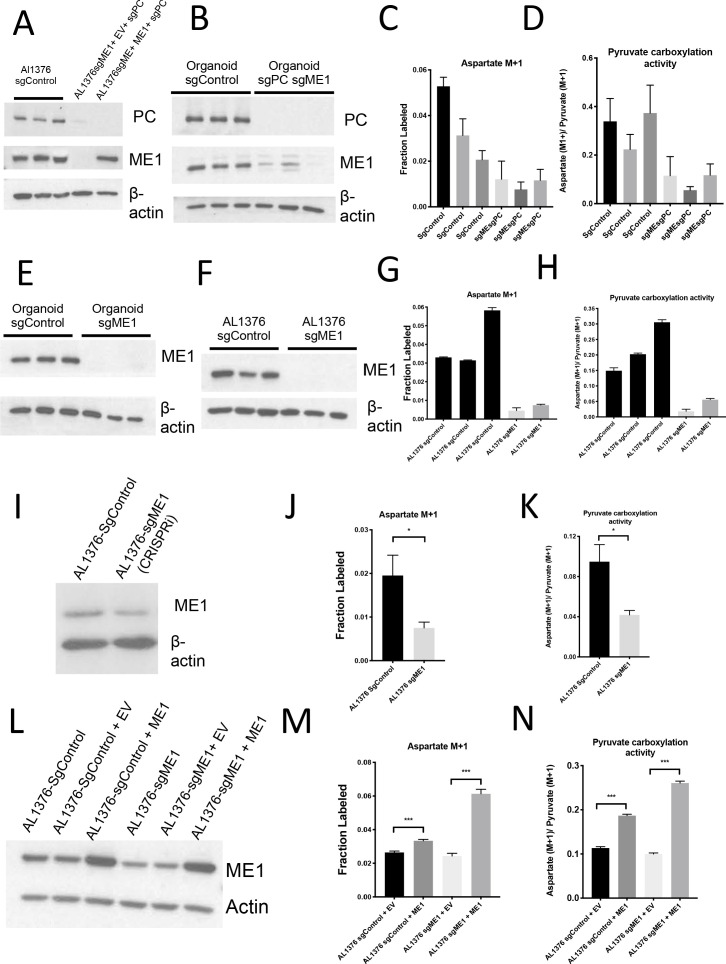
Figure 7—figure supplement 1. Malic enzyme 1 contributes to pyruvate carboxylation activity in PDAC cells and is important for tumor growth.

Figure 7—figure supplement 1.

(A) Western blot for PC and ME1 expression levels in double knockout AL1376 PDAC cells compared to control and ME1 rescue cells using β-actin as a control. (B–D) CRISPR/Cas9 was used to knockout both PC and ME1 in murine PDAC organoids. (B) Fractional labeling of aspartate following 24 hr of 1-13C-pyruvate tracing. Mean +/- SD is shown. (C) Aspartate M+1 isotopomer labeling was normalized to pyruvate M+1 labeling as a surrogate for pyruvate carboxylase activity following 24 hr of 1-13C-pyruvate tracing. Mean +/- SD is shown. (D) Western blot for PC and ME1 expression levels in double knockout organoids compared to control organoids using β-actin as a control. (E–G) CRISPR/Cas9 was used to knockout ME1 in AL1376 PDAC cells. (E) Western blot analysis of ME1 expression levels in sgME1 knockout organoids compared to sgControl organoids using β-actin as a control. (F) Western blot analysis of ME1 expression levels in single-cell cloned sgME1 knockout AL1376 PDAC cells compared to sgControl clones using β-actin as a control. (G) Fractional labeling of aspartate following 24 hr of 1-13C-pyruvate tracing. Mean +/- SD is shown. (H) Aspartate M+1 isotopomer labeling was normalized to pyruvate M+1 labeling as a surrogate for pyruvate carboxylase activity following 24 hr of 1-13C-pyruvate tracing. Mean +/- SD is shown. (I) Western blot for ME1 expression levels in AL1376 murine sgME1 PDAC cell line compared to sgControl cell line made using CRISPRi using β-actin as a control. (J) Fractional labeling of aspartate M+1 following 24 hr of 1-13C-pyruvate tracing in AL1376 murine sgME1 PDAC cell lines compared to sgControl cell lines. The difference in labeling between AL1376 sgControl cells and sgME1 cells (p=0.0126) was significant based on unpaired, two-sided Student’s t tests. Mean +/- SD is shown. (K) Aspartate M+1 isotopomer labeling from (I) was normalized to pyruvate M+1 labeling as a surrogate for pyruvate carboxylation activity following 24 hr of 1-13C-pyruvate tracing. The difference in pyruvate carboxylation activity between AL1376 sgControl cells and sgME1 cells (p=0.0065) was significant based on unpaired, two-sided student’s t tests. Mean +/- SD is shown. (L) Western blot for ME1 expression levels in AL1376 murine sgME1 knockdown and ME1 overexpression PDAC cell lines compared to sgControl cell lines using β-actin as a control. (M) Fractional labeling of aspartate M+1 following 24 hr of 1-13C-pyruvate tracing in AL1376 murine sgME1 and ME1 rescue PDAC cell lines compared to sgControl cell lines made using CRISPRi. Labeling is significantly increased in AL1376 sgControl + ME1 cells compared to sgControl + EV cells (p=0.0005) and AL1376 sgME1 + ME cells compared to sgME1 + EV cells (p<0.0001). Mean +/- SD is shown. (N) Aspartate M+1 isotopomer labeling from (L) was normalized to pyruvate M+1 labeling as a surrogate for pyruvate carboxylation activity following 24 hr of 1-13C-pyruvate tracing. Pyruvate carboxylation activity is significantly increased in AL1376 sgControl + ME1 cells compared to sgControl + EV cells (p<0.0001) and AL1376 sgME1 + ME1 cells compared to sgME1 + EV cells (p<0.0001). Mean +/- SD is shown.
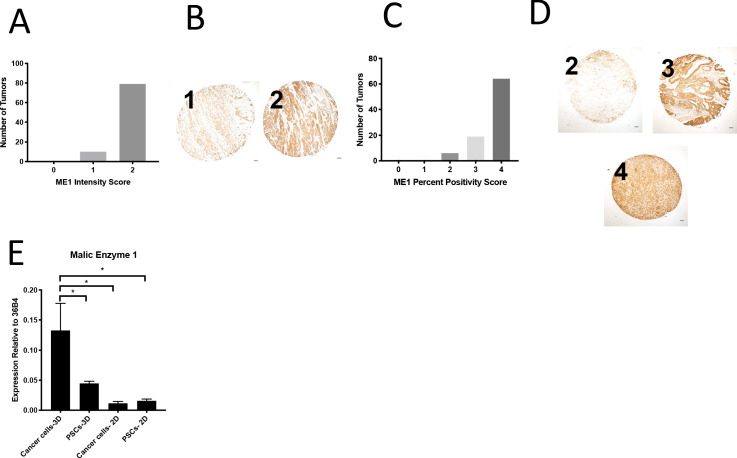
Figure 7—figure supplement 2. Expression of ME1 in a human PDAC tissue microarray and in murine organoids and stroma.

Figure 7—figure supplement 2.

(A) Distribution of ME1 staining intensity scores from a tissue microarray containing sections from 100 human pancreatic tumors. (B) Representative TMA cores containing human pancreatic tumors showing ME1 staining intensity scored as 0, 1, or 2. Scale bars represent 100 μm. (C) Distribution of the scores for percentage of cells in each sample of a tissue microarray containing sections from 90 human pancreatic tumors that were positive for ME1 staining. (D) Representative TMA cores containing human pancreatic tumors showing percentage of cells in each sample that were positive for ME1 staining, scored as 0–4. Scale bars represent 100 μm. (E) Expression of ME1 was measured by qPCR in PDAC or PSC cell lines or from cells sorted from organoid-PSC co-cultures. The difference between cancer cells in 3D compared to PSCs in 3D (p=0.0285), cancer cells in 2D (p=0.0098), or PSCs in 2D (p=0.0111) is significant based on unpaired, two-tailed student’s t-tests. Mean +/- SD is shown. 36B4 was used as a housekeeping gene control.