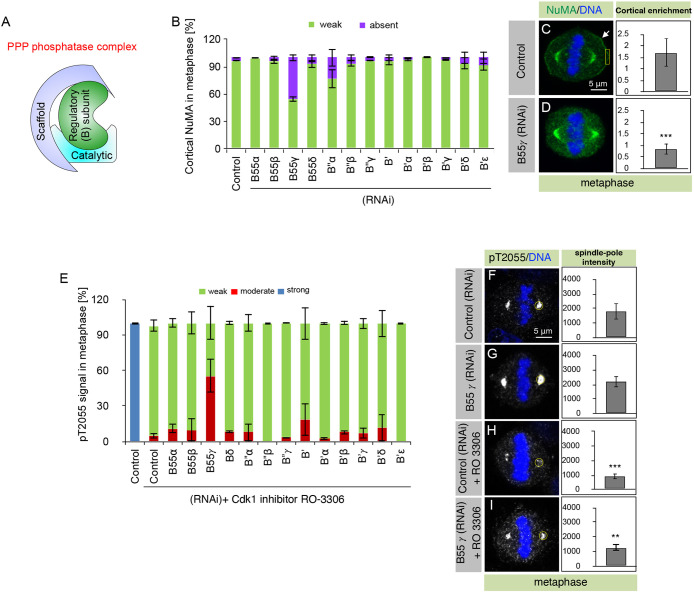
Fig. 1.
PP2A-B55γ is required for NuMA dephosphorylation at Cdk1 site T2055. (A) Schematic representation of a PPP phosphatase complex containing a catalytic subunit, a regulatory (B) subunit, and a scaffold subunit. (B) HeLa cells, transfected with control siRNAs or siRNAs against all thirteen different PP2A regulatory subunits, as indicated, were assayed for NuMA localization in metaphase. Cells were fixed 72 h after siRNA transfection and stained for NuMA. Stacked columns show the extent of cortical NuMA that was visually quantified under the epifluorescence microscope, and categorized as either absent (violet bars; example cell is shown in D) or weak (green bars; example cell is shown in C). More than 50 cells were analyzed in each condition, and the experiments were repeated three times. Data are mean±s.d. calculated from the percentage of cells in each category (weak or absent) from three independent experiments. Two or three different siRNAs were tested for each gene (see Table S1). Also, note that there could be potential false negatives in the dataset as we have not assayed the knockdown efficiency for each siRNA. (C,D) Metaphase HeLa cells transfected with control siRNAs (C) or siRNAs against B55γ (D). Cells were fixed 72 h after siRNA transfection and stained for NuMA (green) and DNA (blue). Arrows indicate cortical localization. Quantification of cortical enrichment was performed in an area of size 1.8 μm×4 μm (yellow box; see Materials and Methods for detail). Quantification of mean±s.d. cortical enrichment is shown for ten metaphase cells in each condition. (E) HeLa cells, transfected with control siRNAs or siRNAs against the thirteen regulatory PP2A subunits, and treated with Cdk1 inhibitor RO-3306 (10 μM; Vassilev et al., 2006) for 5 min, were assayed for pT2055 in metaphase. Cells were fixed 72 h after siRNA transfection and stained with an antibody against pT2055. Stacked columns show the extent of pT2055 signal at the spindle poles, as quantified visually under the epifluorescence microscope, and categorized as either weak (comparable to control cells upon RO-3306 treatment, green bars; example cell shown in H), strong (blue bars; example untreated control cell shown in F), or moderate (signal between weak and strong, red bars; example cell shown in I). More than 50 cells were analyzed in each condition, and the experiment was repeated three times. Data are mean±s.d. calculated from the percentage of cells in each category (weak, moderate or strong) from three independent experiments. (F–I) Metaphase HeLa cells transfected with control siRNAs (F), siRNAs against B55γ (G), control cells that were treated with RO-3305 for 5 min (H), or B55γ siRNA-treated cells that were treated with RO-3306 for 5 min (I). pT2055 signal is shown in gray and DNA is shown in blue. Quantification of spindle pole enrichment was performed for ten representative cells using a 16 µm2 region (yellow) and adjusted for background signal (see Materials and Methods for detail). Data are mean ±s.d. P=0.156 between control and B55γ siRNA-treated metaphase cells for the spindle pole, P<0.0001 between control untreated and RO-3306-treated cells, and P=0.0048 between control RO-3306-treated and B55γ siRNA RO-3306-treated cells. **P<0.01, ***P<0.0001 (two-tailed Student's t-test).

