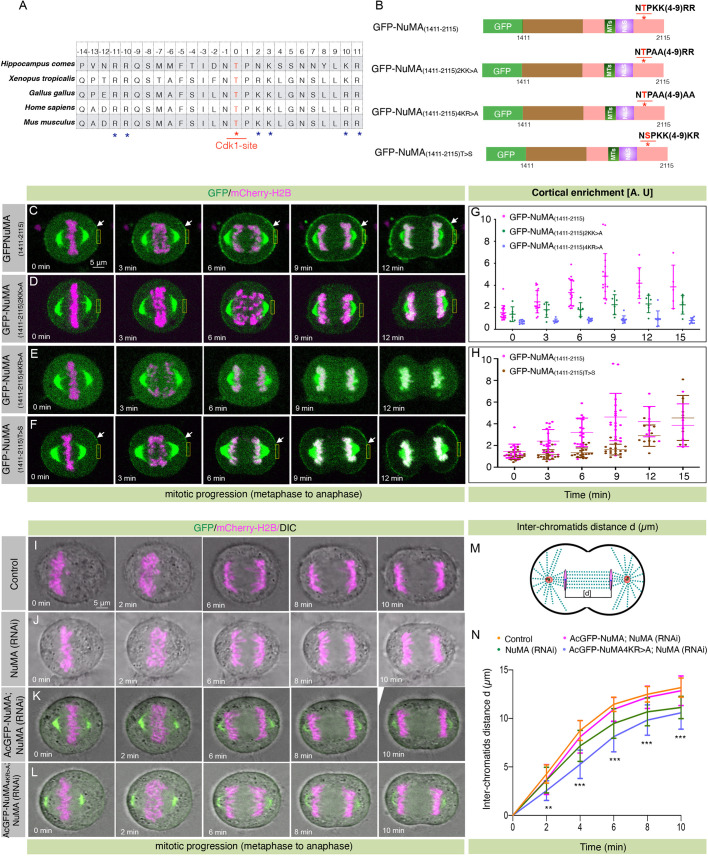
Fig. 5.
Polybasic residues in the vicinity of T2055 are necessary for cortical NuMA enrichment. (A) Sequence alignments of NuMA amino acid sequence near T2055 from various NuMA orthologs. A red asterisk marks the Cdk1 phosphorylation site, and blue asterisks show basic amino acids. (B) Schematic representation of wild-type fragment of NuMA(1411–2115) tagged with GFP at the N-terminus, and several mutant forms where either two or four basic residues were mutated to alanine (2KK>A, 4KR>A), or where the conserved threonine residue was mutated to serine (T>S). Asterisks indicate T2055; MTs, region mediating interaction with microtubules; NLS, nuclear localization signal. (C–F) Images from time-lapse microscopy of HeLa cells stably expressing mCherry–H2B and were transfected with GFP–NuMA(1411–2115) (C), GFP–NuMA(1411–2115)2KK>A (D), GFP–NuMA(1411–2115)4KR>A (E), and GFP–NuMA(1411–2115)T>S (F). The GFP signal is shown in green and mCherry signal is in magenta. Note the significant loss of cortical NuMA in cells expressing GFP–NuMA(1411–2115)2KK>A or GFP–NuMA(1411–2115)4KR>A. Also, note the dramatically weaker cortical GFP signal in cells expressing GFP–NuMA(1411–2115)T>S. Arrows indicate cortical GFP localization and boxes indicate examples of regions used for quantification. (G) Quantification of cortical enrichment for cells that underwent metaphase to anaphase transition, as shown in C–E (see Materials and Methods for detail). Data show mean±s.d. for n>5 cells, with individual data points plotted. GFP–NuMA(1411–2115) versus GFP–NuMA(1411–2115)2KK>A; P=0.28, 0.83, 0.032, 0.006, 0.023 and 0.068 for 0, 3, 6, 9, 12 and 15 min, respectively. GFP– NuMA(1411–2115) versus GFP–NuMA(1411–2115)4KR>A; P=0.0003 at 0 min, P<0.0001 at 3–15 min timepoints (two-tailed Student's t-test). (H) Quantification of cortical enrichment for cells that underwent metaphase to anaphase transition, as shown in C and F. Data show mean±s.d. for ≥18 cells, with individual data points plotted. GFP–NuMA(1411–2115) versus GFP–NuMA(1411–2115)T>S; P=0.89, 0.04, 0.002, <0.0001, 0.18 and 0.35 for 0, 3, 6, 9, 12 and15 min, respectively. (I–L) Images from time-lapse microscopy of HeLa Kyoto cells stably expressing mCherry–H2B (I), stably expressing mCherry–H2B and depleted of endogenous NuMA (J), stably co-expressing AcGFP–NuMA and mCherry–H2B and depleted of endogenous NuMA (K), or stably co-expressing AcGFP–NuMA4KR>A and mCherry–H2B and depleted of endogenous NuMA (L). The GFP signal is shown in green, the mCherry signal is in magenta. (M) Schematic representation for the calculation of the distance [d] between inter-chromatids in cells that underwent anaphase progression. (N) Quantification of inter-chromatid distance in cells as shown in I–L. Data are mean±s.d. inter-chromatid distances during anaphase progression for more than 15 cells in each condition (see Materials and Methods). **P=0.0002 at 2 min, ***P<0.0001 for 4–10 min timepoints between AcGFP–NuMA- and AcGFP–NuMA4K>R-expressing cells upon depletion of endogenous NuMA (two-tailed Student's t-test).

