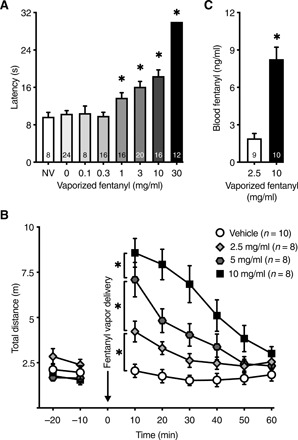
Fig. 1. Vaporized fentanyl induces analgesia and increases locomotor activity.

(A) Passive administration of vaporized fentanyl (four vapor deliveries over 8 min) increased the latency to nociception in the hot-plate test [one-way analysis of variance (ANOVA); F7,112 = 38.45; P < 0.0001] in a concentration-dependent manner. Sidak’s multiple comparisons test shows that the 1, 3, 10, and 30 mg/ml groups were significantly different from vehicle. “NV” indicates mice that were not exposed to fentanyl or vehicle vapor. (B) Locomotor activity in meters was measured at baseline and after passive exposure to different concentrations of vaporized fentanyl (five vapor deliveries over 10 min) versus vehicle vapor (0 mg/ml). Locomotor activity increased with the concentration of vaporized fentanyl [two-way repeated-measures (RM) ANOVA; concentration × time interaction F15,150 = 10.14; P < 0.0001]. Sidak’s multiple comparisons test shows significant differences in locomotion between the different concentrations. (C) Blood fentanyl levels in response to five fentanyl vapor deliveries (2.5 mg/ml: 1.91 ± 0.39 ng/ml; 10 mg/ml: 8.27 ± 0.95 ng/ml) that were passively delivered over 1 hour (unpaired t test; t17 = 5.93; P < 0.0001). The ratio of fentanyl blood levels at 10 and 2.5 mg/ml (8.27/1.91 = 4.3) is a close approximation of the ratio of fentanyl concentrations (10/2.5 = 4). The regression analysis of measured blood fentanyl levels yields a slope a = 0.85 (CI: 0.55 to 1.15; F1,17 = 35.14; r2 = 0.67; P < 0.0001), which is not different from the presumed linear metabolism slope (; test of equal slopes F1,17 = 0.033; P = 0.86), suggesting that fentanyl metabolism was linear within the range of five vapor deliveries over 1 hour at 2.5 and 10 mg/ml, equivalent to a range of 12.5 to 50 mg/ml per hour. The number of mice (n) is shown in the graphs. The data are expressed as means ± SEM. *P < 0.05.
