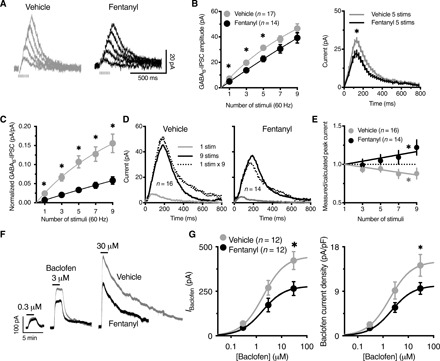
Fig. 6. Fentanyl vapor self-administration reduces GABAB receptor currents in VTA dopamine neurons through pre- and postsynaptic mechanisms.

(A) Representative traces of GABAB IPSCs evoked by one, three, five, seven, or nine electrical stimuli (60 Hz) in slices from mice with a history of short access to vehicle versus fentanyl self-administration. Stimulus artifacts were blanked for clarity. (B) The amplitude of GABAB IPSCs was reduced in neurons from fentanyl versus vehicle mice, shown as the peak amplitude for one, three, five, seven, or nine stimuli (left; two-way RM ANOVA; F1,29 = 5.44; P = 0.027) and full time course for IPSCs evoked by five stimuli (right) (vehicle area under the curve = 6454, CI: 6117 to 6791; fentanyl area under the curve = 4709, CI: 4476 to 4942). (C) The plot of GABAB IPSC amplitudes that were normalized to the intensity of electrical stimulation shows a greater difference between vehicle and fentanyl GABAB IPSCs (stimulus × treatment interaction F4,116 = 9.12; P < 0.0001). (D) Representative traces of the arithmetically summed GABAB IPSCs (1 stimulus × 9) versus measured GABAB IPSC that were evoked by nine stimuli (9 stims) in slices from vehicle mice (left) (measured < calculated), suggesting paired-pulse depression, and fentanyl mice, (right) (measured > calculated), suggesting paired-pulse facilitation. (E) Ratio of the measured GABAB-IPSC amplitude over the calculated amplitude for each number of stimuli. Linear regression shows a significantly negative slope for vehicle (a = −0.02; F1,63 = 12.3; P = 0.0008) and a significantly positive slope for fentanyl (a = 0.021; F1,55 = 7.282; P = 0.009). (F) Representative traces of whole-cell voltage-clamp recordings (baselined and peak-aligned) from vehicle versus fentanyl mice, demonstrating the concentration-dependent outward current produced by the application of (R)-baclofen. (G) The maximal outward current that was produced by (R)-baclofen was reduced in neurons from fentanyl mice compared with vehicle mice (left). The data were analyzed by nonlinear regression (sigmoidal fit; vehicle, Emax = 446.9 pA; fentanyl, Emax = 279.6 pA; F1,51 = 7.35; P = 0.009). No change in the EC50 was observed (vehicle, EC50 = 1.87 μM; fentanyl, EC50 = 1.77 μM). When the amplitude of the outward current was normalized to membrane capacitance (current density, pA/pF), the response to (R)-baclofen was still lower in fentanyl neurons (right). Solid lines represent the sigmoidal fit of the data. n, number of cells. The data are expressed as means ± SEM. *P < 0.05.
