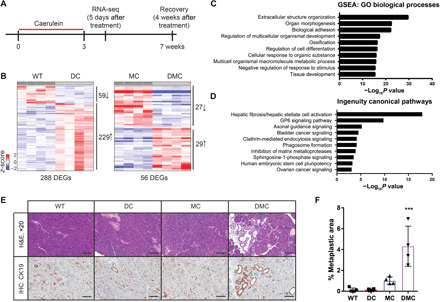
Fig. 3. Daxx loss cooperates with inflammation and Men1 deficiency to affect the transcriptional state of the pancreas.

(A) Schematic representation of experimental outline. (B) Heatmaps representing Daxx-dependent gene expression changes in DC compared with WT mouse pancreases and in DMC compared with MC mouse pancreases following treatment with caerulein. (C) Gene Ontology (GO) biological processes pathway analysis of DEGs in DC mouse pancreases compared with WT controls. GSEA, Gene Set Enrichment Analysis. (D) Ingenuity Pathway Analysis of DEGs in DC mouse pancreases compared with WT controls. (E) Representative histologic images and immunohistochemistry for cytokeratin 19 (CK19) of pancreas sections 4 weeks following the final dose of caerulein. Image magnification is ×20; scale bars, 100 μm. (F) Quantification of metaplastic areas as a percentage of total pancreas area (mean ± SD); ***P < 0.001, analysis of variance with Dunnett’s posttest comparing all groups with WT controls.
