
Fig. 3.
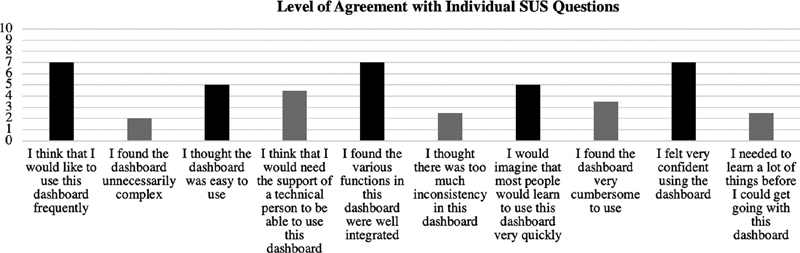
Summary of System Usability Scores (SUS) by individuals' components. Bars in black are positively worded and those in gray are negatively worded. Negatively worded responses are transformed in order for lower scores to indicate more favorable responses.