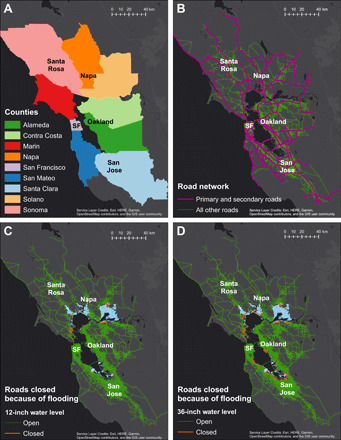
Fig. 1. The San Francisco Bay Area study site.

(A) The nine counties of the San Francisco Bay Area. The cities of Santa Rosa, Napa, San Francisco (labeled SF), Oakland, and San Jose are shown for reference. The North Bay includes Napa, Marin, Sonoma, and Solano counties, depicted in orange and red; the East Bay includes Alameda and Contra Costa counties, depicted in green, and the South Bay and Peninsula include Santa Clara, San Mateo, and San Francisco counties, depicted in blue and purple. (B) The regional road network used in our model. Numbered roads (primary and secondary roads) are shown in magenta. (C) The flood map for the 12-inch water level overlying the road network. (D) The flood map for the 36-inch water level overlying the road network. In both (C) and (D), the areas of inundation are shown in blue, while the roads closed because of flooding are shown in red.
