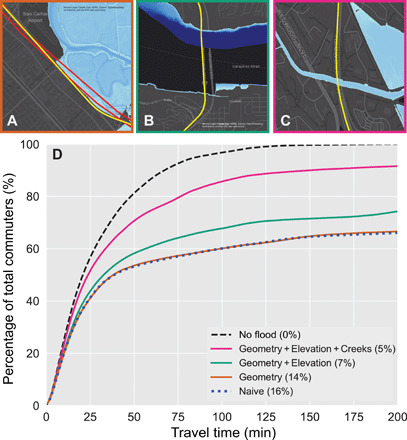
Fig. 2. The effects of model corrections on estimations of regional travel time delays.

Model corrections were introduced during dataset integration to reduce biases in the process of identifying inundated roads. (A) Geometry correction, which represents the correction of the location and curvature of the primary and secondary roads. (A) shows a portion of U.S. 101 curving around the flooded region, in yellow, and the original, simplified straight-line road geometry intersecting the flood map, in red. (B) Elevation correction, which represents the incorporation of the primary and secondary road elevations above the ground. (B) shows the Carquinez Bridge elevated above the inundated region for the 36-inch water level. (C) Creek correction. A road segment is considered flooded if more than 17% of its length is flooded. (C) shows how the creek correction applies to the case of incorrect flooding for the U.S. 101 as it crosses the San Rafael Creek. (D) Cumulative distribution of travel time for commuters across the San Francisco Bay Area for the 36-inch water level computed with the various corrections. The naive approach, shown with a dotted line for easier distinction, represents overlaying the flood map on the road network with no corrections. The data inside the parentheses in the legend indicate the percentage of impassable commutes for a given water level.
