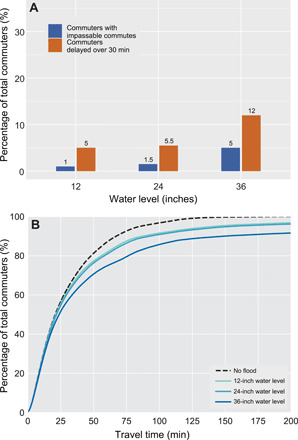
Fig. 3. Impassable commutes and travel time delays for all commuters.

(A) Bar plot of the percentages of commuters experiencing impassable commutes and travel time delays exceeding 30 min for every water level. (B) The cumulative percentage of all commuters and their projected travel times for every water level.
