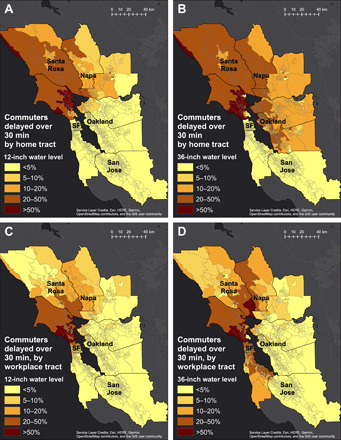
Fig. 4. Percentage of commuters experiencing more than 30 min of delays for 12- and 36-inch water levels, aggregated to census tracts.

(A) Commuters by home tract for the 12-inch water level. (B) Same as (A), for the 36-inch water level. (C) Commuters by workplace tract for the 12-inch water level. (D) Same as (C), for the 36-inch water level. County borders are shown in black.
