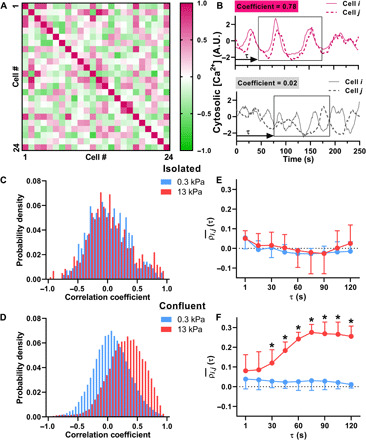
Fig. 2. Effect of matrix stiffness and confluence on the correlated nature of Ca2+ oscillations.

(A) The cross-correlation coefficients (ρi,j) range in values from 1 (positively correlated, pink) to 0 (uncorrelated, white) to −1 (negatively correlated, green), as shown in a representative 24 × 24 cell matrix. (B) Examples of Ca2+ oscillations measured in two cells with high pairwise correlation (ρ = 0.78) and low pairwise correlation (ρ = 0.02). A.U., arbitrary units. (C) In isolated cells, the Ca2+ oscillations were generally uncorrelated with a probability density function centered around zero. ECM stiffness did not affect pairwise correlations in isolated SMCs (soft, N = 5; stiff, N = 4; P = 0.733, two-way ANOVA). (D) In confluent cells, there is a statistically significant increase in ρ, indicating that the Ca2+ oscillations were more synchronized on stiffer ECM (soft, N = 4; stiff, N = 5; two-way ANOVA, P = 0.007). (E and F) To evaluate the time it takes after agonist addition for Ca2+ oscillations to become synchronized, we calculated ρi,j(τ) within a 120-s moving window. (E) ρi,j(τ) in isolated cells does not change over time (soft, N = 5; stiff, N = 4; P = 0.274) or with stiffness (P = 0.303) (two-way ANOVA). (F) However, in confluent cells on stiff matrix, ρi,j(τ) shows a significant increase after 30 s (soft, N = 4; stiff, N = 5) (two-way ANOVA, P < 0.001). Error bars indicate SD.
