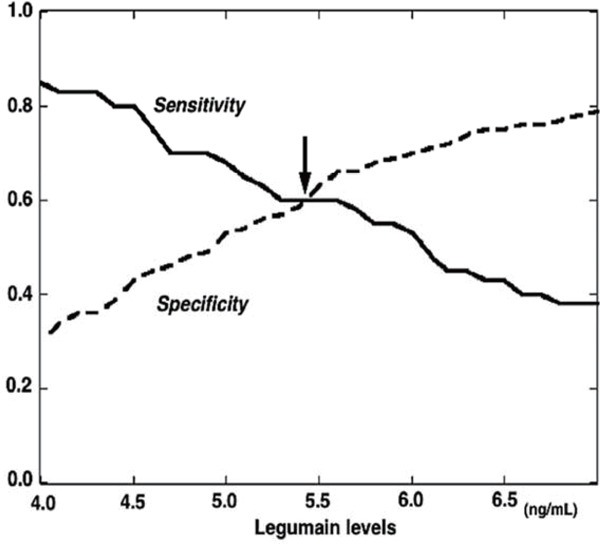
Fig. 2.

The relative cumulative frequency distribution curve for the optimal cutoff point of legumain levels for complex lesions
The curve indicates that the optimal cutoff point of legumain levels for complex lesions is around 5.5 ng/mL. The arrow indicates the optimal cutoff point of legumain levels.
