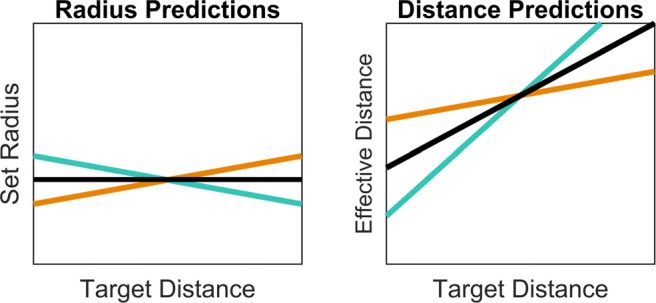
Fig. 3.

Two sets of possible trends in how setting might vary with distance, and the interpretation of these in terms of misperception of distance. The Radius Predictions shows the trend of true constancy in black, with an intercept of what the radius of the physical stimuli is, and slope of 0; under-constancy, the prediction based on prior research, is shown in orange, in which settings are made too small at close distances and too large at far distances. The opposite possible trend, of over-constancy, is shown in turquoise, with setting being too large at close distances and too small at far distances. The Distance Predictions shows the possible trends for the effective distances from the radius settings with accurate perception of distance having an intercept of zero and slope of one in black; underestimation shown with a slope of less than 1 in orange and overestimation with a slope of greater than 1 in turquoise. Predictions have been made with a non-zero intercept, since accurate settings tend to be made at an intermediate distance
