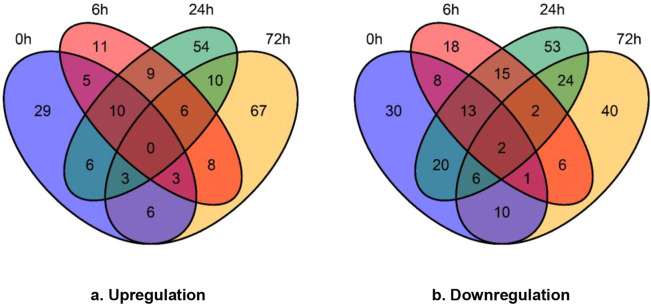
Figure 1.
The numerical distribution of differentially expressed proteins in Qingliu compared with TN1 at the four time points of insect herbivory. (a) Upregulated and (b) downregulated proteins in Qingliu compared with TN1. A protein was considered differentially expressed if the fold change was >1.5 (for upregulation) or <0.67 (for downregulation), p-value <0.05 and CV < 20%. The blue, red, green and yellow sections of the Venn diagram represent the insect herbivory time points of 0, 6, 24 and 72 h, respectively.

