
Fig. 1. Three-class factor mixture model distress solution (x-axis) plotted against the continuous distress severity scores (y-axis).
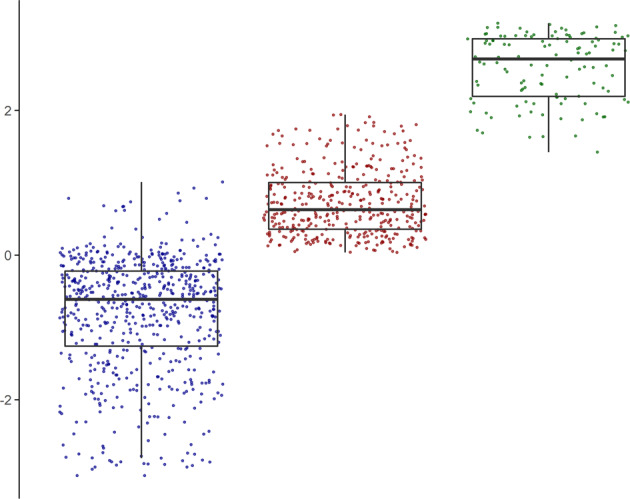
Left boxplot = low/mild distress class (n = 623); middle boxplot = moderate distress class (n = 390); right boxplot = high distress class (n = 117). Centre line = median (50% quantile); lower box limit = 25% quantile; upper box limit = 75% quantile; lower whisker = smallest observation greater than or equal to the lower box limit − 1.5 × inter quartile range (IQR); upper whisker = largest observation less than or equal to the upper box limit + 1.5 × inter quartile range (IQR).